The May-June issue of American Scientist has been out for a week or so. My “Computing Science” column talks about a curious randomized version of the factorial function, which for lack of a better name I’ve called a factoidal function. I encourage everyone to rush right out and read all about it, but that’s not my only reason for posting this note here. I also have to report that in my discussion of factorials and factoidals, there’s at least one point where I have strayed from the factual.
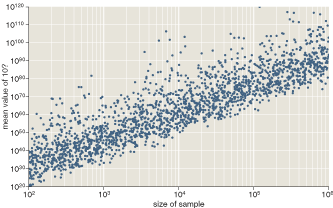
Here is the central figure in the article:

It shows the “average” value of factoidal(10) as a function of the size of the sample over which the average is calculated. (To understand why the “average” depends on the sample size (and therefore isn’t really an average), please see the article.) Both in the caption that accompanies this figure and in the text of the article, I describe the graph as showing exponential growth. Ernst Zinner of Washington University in St. Louis writes to point out that the description is incorrect. Although it’s true that the dependent variable (the value of the “average”) increases exponentially, so does the independent variable (the sample size). Consequently, the relation between the variables is characterized not by an exponential function but by a power law. This concept is introduced later in the article, but my description of the figure unfortunately sows confusion. My thanks to Zinner for setting me straight.