
At the 50th anniversary of the March on Washington I find myself writing again about racial segregation, and specifically about Thomas C. Schelling’s mathematical model of how people wind up living in monochrome neighborhoods. I have mentioned Schelling’s model several times before (e.g., 2004, 2006, 2010). Now it’s the subject of my new “Computing Science” column in the September-October American Scientist.
My reason for returning to the subject yet again is not just that the issue never goes away. It turns out there’s a new theoretical development, which to some extent alters the interpretation of the model.
In Schelling’s model individuals have a fixed intolerance threshold, τ, between 0 and 1. If the fraction of like-colored neighbors is less than τ, the resident will seek a new home elsewhere. Most often, τ is set equal to 1/2, and so each person’s preference is simply not to be in a minority. Thus a totally integrated housing pattern, in which everyone has equal numbers of black and white neighbors, would be acceptable to all. But that’s not the outcome the model predicts.
In one of my earlier articles, I described Schelling’s findings as follows:
The model suggests that extreme segregation can arise spontaneously even when no one in the population desires that outcome…. Neither race seeks to escape or exclude the other; the only racial preference is of the mildest sort—a desire not to be entirely cut off from people of one’s own group. But that desire is enough to cause the two populations to separate like oil and water.
There may be versions of the model for which those statements are true, but it’s now clear that my description is too strongly worded when applied to the specific models that Schelling studied in his first publications on the subject, circa 1970.
Schelling began with one-dimensional models, where individuals are arranged along a line. In a 1971 paper he presented his results in “typewriter diagrams,” representing the races by ‘+’ and ‘o’ symbols, with dots to mark those individuals who are unhappy with the racial composition of their neighborhood. After repeatedly applying his movement procedure (which I’ll explain below), everyone is happy but the races have separated into homogeneous blocks.
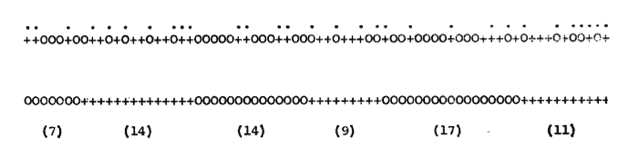
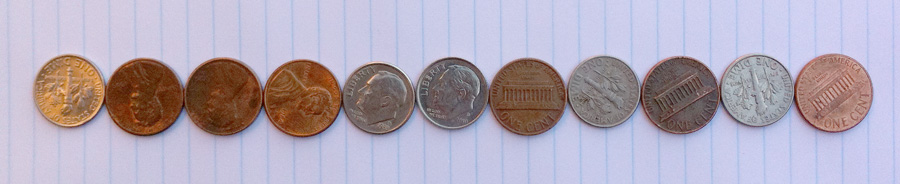
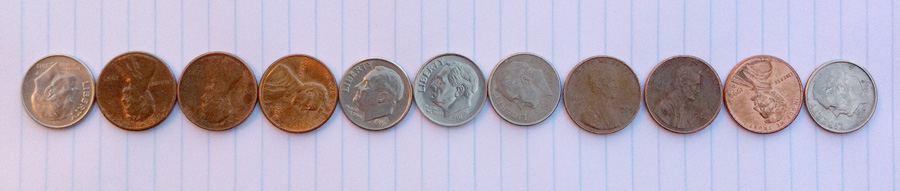
Schelling also mentioned experiments in which the model becomes a game played with coins. Again, a random initial state evolves into a stable, somewhat segregated final state:
The new theoretical discoveries concern one-dimensional models much like Schelling’s original. The first results were reported last year at the Symposium on the Theory of Computing by a group I shall identify as BIKK: Christina Brandt, Nicole Immorlica, Gautam Kamath and Robert Kleinberg (arXiv preprint). The findings are based on analytical methods rather than computer simulations.
The BIKK model is one-dimensional, but with the ends of the line joined to form a ring. Three parameters define an instance of the model: The population size N, the intolerance threshold τ and the neighborhood radius w, which specifies how far to the left and right each agent looks when assessing neighborhood composition. Each agent’s neighborhood includes 2w + 1 sites, including the agent itself. The BIKK analysis was confined to models with τ = 1/2, with N large and w \(\ll\) N. The system evolves through an exchange process: At each step, two unhappy agents of opposite color are chosen at random and made to switch places; with τ = 1/2, the exchange is guaranteed to make them both happy. The moves continue until no more qualifying pairs can be found.
The BIKK group was able to prove that this process always terminates; it can’t get stuck in an endless cycle where the same agents keep shuffling from place to place. Furthermore, they were able to characterize the degree of segregation in the final state: The mean length of the monochromatic runs is a polynomial function of w, the neighborhood size; it is not a function of N, the population size. This is an important distinction. It means the model with τ = 1/2 cannot account for the kind of metropolitan-scale segregation seen in many large American cities. Instead it predicts smaller, neighborhood-size clusters of each race.
The key idea behind this result is the observation that whenever a monochromatic cluster reaches a size of w + 1, it can never be invaded or broken up by the opposite color. The BIKK workers prove that many such “firewall” clusters will almost surely evolve in any large-N system, and so they cannot grow very large before they bump into one another. As Kleinberg put it in an email: “What prevents segregation from happening on a massive scale is that smaller-scale segregation happens first.” For a little more on how the proof works, see my column; for a lot more, see the BIKK paper.
As noted above, the BIKK result considers only the case of τ = 1/2. In a subsequent paper, George Barmpalias, Richard Elwes and Andy Lewis-Pye analyzed the same family of models across the entire spectrum of τ values, from 0 to 1. They discovered an intriguing phase diagram, which includes regions of more severe segregation (i.e., longer monochromatic runs) both for higher values of τ and also for certain ranges of lower values. The latter result seems paradoxical: A greater tolerance for racial diversity leads to a more segregated society. But the explanation is not so hard to fathom: Agents willing to accept minority status are less likely to assemble into monochromatic “firewalls”; with a lower concentration of firewalls, the few that do develop have room to grow larger before they collide.
What does all this tell us about race relations among real people in real cities? The mismatch between the predicted and the observed scale of segregated neighborhoods calls for some explanation. Maybe the prevalence of huge, city-scale racial ghettos means we are much more intolerant than we choose to believe—that the true value of τ in the American population is significantly greater than 1/2. Or, following the result of Barmpalias et al., maybe τ is somewhat less than 1/2, putting us into the “paradoxical” regime. Another possible explanation lies in the one-dimensionality of the solved models; two-dimensional versions of the Schelling model may have significantly different behavior. (Extending the analytic methods to the two-dimensional case looks difficult.)
I can pile on one more hypothesis: The specific models analyzed in these two papers are “zero temperature” models, without any sort of thermodynamic noise. Two agents can exchange places only if the move is strictly beneficial to both of them; unfavorable or even neutral moves never take place. The zero temperature assumption may not be the best approximation to the real world, where people have imperfect knowledge and sometimes act outside the bounds of strict rationality. Perturbed models that admit some small probability of unfavorable actions seem to predict quite different global behavior. But, again, including nonzero temperature effects makes analysis harder.
Finally, one might also entertain the possibility that an emotionally frought and historically complex social institution is unlikely to yield all its secrets to a very simple, abtract, mathematical model.
There’s one further point to make about the model itself. The prediction of self-limiting segregation in the τ = 1/2 case came as a surprise to me, but it should not have. A glance at Schelling’s own diagrams (including the one reproduced above) shows that the small scale of the racially divided neighborhoods could have been guessed as early as 1971—but Schelling did not call attention to this fact. It was apparently first noted about five years ago by Dejan Vinkovic and Alan Kerman and then by Dietrich Stauffer and S. Solomon.
The BIKK model is very similar to Schelling’s original scheme, but not quite identical. The main difference is that instead of exchanging pairs of unhappy agents, 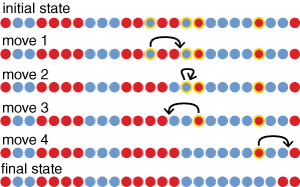 Schelling moved each unhappy agent to the nearest position where it would be happy. The displaced agent intruded itself between two other sites, with all the intervening agents shifting left or right to make room. Sometimes such a move would alter the status of other agents in the old or the new neighborhood, so that a previously happy individual would become discontented, or an unhappy one would become satisfied without having to move. As a model of residential segregation, this mechanism is rather peculiar; households don’t elbow their way in between neighboring houses. Nevertheless, the model has one important property that distinguishes it from all the later variants: It is wholly deterministic. Nothing about the model is random except for the initial distribution of the agents. Given a specific initial configuration, the evolution of the system can be predicted with certainty.
As far as I know, Schelling’s deterministic model has not been studied much since he worked on it more than 40 years ago. (One reason might be that although it’s easy to implement the model with pencil and paper or with coins, it becomes quite a mess when you try to encode the rules in a computer program.) I was curious about whether this model also predicted self-limiting segregation—in other words, whether the mean run length is a function of w or of N. Some experiments provide pretty clear evidence:
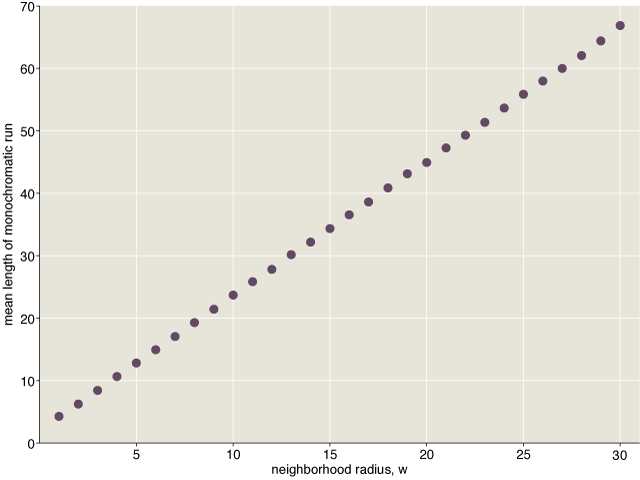
The mean run length appears to have a simple linear relation to w. This is consistent with the BIKK group’s findings for their random-exchange version of the model. They have proved that the mean run length of monochromatic blocks grows no faster than \(w^2\), and they believe the true rate of growth is probably linear in \(w\).
If you allow different households to have different levels of tollerance yoou might get interesting effects. Also when you have households die when they get too old, you get very different dynamics. Perminent patterns are not so perminent.
Bidirectional lists would be the obvious way to simulate Schelling’s shillings, er, pennies.
Great article! I fully agree that “the absurd simplicity of the model is also its main fascination”. (I might borrow that line, if I may.)
Here are a couple of blog-posts (including pictures from simulations) that I wrote about our work:
http://richardelwes.co.uk/2013/06/14/schelling-segregation-part-1/
http://richardelwes.co.uk/2013/06/18/schelling-segregation-part-2/