Unnatural Logarithms
by Brian Hayes
Published 1 June 2008
I have a longstanding friendly feud with my Editor-in-Chief over the use of logarithmic scales in graphs. I tend to go for a log plot if there’s the slightest hint of an exponential trend in the data; she argues that the human sense of numbers is inherently linear, and thus a nonlinear scale should be used only in exceptional circumstances. Linear is natural, she says; logs are for geeks.
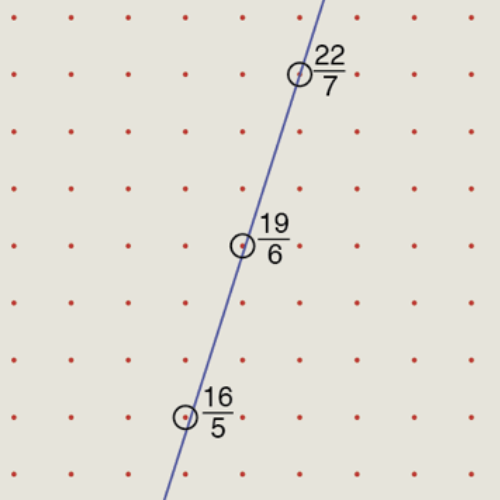
 Vindication is always sweet, so I was delighted to see a report in the latest issue of Science (subscription needed for full-text access) suggesting that members of an Amazonian indigenous group seem to order numbers on a logarithmic scale. Stanislas Dehaene, Véronique Izard, Elizabeth Spelke and Pierre Pica worked with 33 adults and children of the Mundurucu group in Brazil’s Para province. The subjects were shown a line segment with labeled end points (illustration above) and asked to place various other numbers within this interval. The numbers were presented as patterns of dots, as sequences of tones or as spoken number words in the Mundurucu language or in Portuguese. The results of the experiment show, according to Dehaene et al.:
The Mundurucu seem to hold intuitions of numbers as a log scale where the middle of the interval 1 through 10 is 3 or 4, not 5 or 6.
In contrast, 16 American control subjects from the Boston area placed numbers on the scale pretty much in proportion to their magnitude.

For the sake of my ongoing quibble with the E-in-C, it’s in my interest to support and endorse this finding. I wish could do so.
 Exactly what does it mean to “hold intuitions of numbers as a log scale”? Simply taking base-10 logarithms of numbers isn’t quite what’s wanted. The logarithm function maps the integers 1 through 10 onto a range from 0 to 1. To map numbers in the domain [1, 10] onto the same co-domain “logarithmically,” we need a transformation along the lines of R = (9 log10 S) + 1, where R is the “response location” and S is the “stimulus number.” But the resulting curve, superimposed in red on the graph above, doesn’t match the experimental data very well at all. And, looking at the data more closely, it’s hard to see how any plausible transformation is going to account for the positions of those dots and error bars. There’s trouble in the middle, where 5 was judged larger than 6. And there’s trouble at both ends: No matter where you place the numbers 2 through 9 on the scale, shouldn’t 1=1 and 10=10? The anomalies at the ends are made more puzzling by the instructions given to the test subjects:
Only two training trials were presented, with sets of dots whose numerosity corresponded to the ends of the scale (1 and 10). The participants were told that these two stimuli belonged to their respective ends, but that other stimuli could be placed at any location.
In view of these instructions, it seems peculiar that stimulus number 1 has a response location near 1.5, and stimulus number 10 corresponds to a response location of roughly 8.
I wonder if the data aren’t better explained by a simple step function. Perhaps the subjects counted dots up to 4, but beyond that merely estimated the number of spots, lumping together any stimulus with 5, 6 or 7 dots in one class, and putting patterns of 8, 9 or 10 spots in a second class.
Or maybe the arrangement is logarithmic after all. The Mundurucu may have a lot more mathematical sophistication than Dehaene et al. give them credit for. When presented with a scale that runs from 1 to 10, rather than 0 to 10, they intuit that the interval belongs to the series …, 0.01, 0.1, 1, 10, 100,…, rather than the more prosaic series …, –10, 0, 10, 20, 30, …. Anyway, I think that’s what I’ll tell my Editor-in-Chief.
Responses from readers:
Please note: The bit-player website is no longer equipped to accept and publish comments from readers, but the author is still eager to hear from you. Send comments, criticism, compliments, or corrections to brian@bit-player.org.
Publication history
First publication: 1 June 2008
Converted to Eleventy framework: 22 April 2025

living overseas and not enjoying the pleasures of electronic access I still will need to wait for a (linear) couple of days to read the original article before being too much opinionated.
however, I have two non-independent comments:
1. regarding linear or log scales for plots. I agree with you; absolutly. but more drastically: I use a log scale whenever there’s the slightest hint of a non-linear trend in the data AND at least 2 (preferibly 3 or more) orders of magnitude appear in the scale (i.e., we go from 1 to 100, or from 10 to 1000). this leads us to the other comment
2. it seems to me dangerous to extract conclusions on the exponential (or, for that matter, potential or scale-free or fractal..) behavior of things when you have information spanning just two orders of magnitude (let alone just one like here). I would find the case much more compelling if the experiment included numbers say, from 1 to 1000 (or as you suggest, probably not without some irony, from 0.1 to 100)
The report is interesting in and of itself, but unless yours is the Editor-in-Chief of “Mundurucu Scientist”, don’t the findings offer some vindication of *her* intuition regarding your readership’s number sense?
Neil Tyson’s “Death by Black Hole” has a well written introduction that discusses the fact that human senses are logarithmic by nature. (And the entire introduction is available online, courtesy Amazon: http://www.amazon.com/gp/reader/0393062244/ ).
The idea that human senses are logarithmic is clearly evident in the usefulness of things like the decibel scale or the use of apparent magnitudes to gauge the brightness of stars.
The latter is actually very interesting, and clear support for your claim. The practice comes from the Greeks, who divided the stars up into six categories of brightness, based on their perception of the brightness of the stars. Later, when more modern astronomers used this data, they found that it had a logarithmic correlation with actual brightness of the star.
Caleb,
Yes, roughly speaking, humans perceive sound and light intensity on a logarithmic scale. So, a ten-fold increase in sound intensity is perceived as a two-fold increase in loudness.
From this fact we cannot, however, conclude that our number sense, or our sense of linear geometric magnitude, is also logarithmic. If I were to draw a 1 cm line and then a 10 cm line on a piece of paper, I don’t think you’d tell me that the second line was twice as long as the first.
I think Weber’s Law reveals something very fundamental about human perception, so it’s always interesting to see it show up in unexpected ways.
Obviously the linearity of the “natural” numbers has been so drilled into our educated minds from early childhood that we are mentally forced to use that number sense in evaluating similar numbers or measurements. But I think this linear number sense is restricted to local regions — much like we treat the surface of the earth as a plane when overall its really an oblate spheroid.
For example, you cite our evaluation of a 10 cm line being 10 times the length of a 1 cm line. But measurement involves two objects — a value and a unit. The values (1, 2, 3…) may be linear, but the units (millimeter, centimeter, decimeter, meter…) are logarithmic. The combination is essentially a logarithmic scale. For every 10 values we bump the units up by 1.
In real life, numbers are always attached to things, and are always accompanied by units; these units subsume the relentless linearity of the numbers into a more natural logarithmic scale. The population difference that turns a “hamlet” into a “village” is insignificant for a city.
Similarly with money. In the U.S. we have money units of 0.01, 0.05, 0.10, 0.25, 0.5, 1, 2, 5, 10, 20, 50, and 100 — also a roughly logarithmic scale. We tend to treat money logarithmically. Everything else being equal, we might be inclined to walk an extra block to save 10 cents on a slice of pizza, but not bother driving the extra mile to save 10 dollars on a widescreen TV.
Our sense of time is also logarithmic. When looking into the past, the last year seems full of detail, years earlier less so, but when we turn our gaze back to distant centuries, whole years and decades go by where seemingly “nothing happens.”
Here’s what might be interesting: Ask children to arrange animals (for example, ranging from ants to elephants) by size on a line to reflect how much bigger one animal is than another. I would bet the children to arrange the sizes logarithmically rather than linearly. (Adults, on the other hand, know “too much” to let their Weber’s Law instincts take over in this taks. Yet, ask even educated adults to draw the Solar System to scale without consulting Wikipedia, and it’ll definitely be scaled in a logarithmic factions)
As a wise mathematician once said, “God invented the logarithms; all else is the work of man.”