The latest issue of American Scientist is just out, both on the newsstand and on the web. My “Computing Science” column is titled “Wagering with Zeno”; it returns to a subject mentioned briefly in an earlier column, “Follow the Money.”
Consider a random walk on the interval (0,1), where the walker moves according to these rules:
- The walker begins at x = 1/2.
- At each step the walker moves either left (toward 0) or right (toward 1) with equal probability.
- The length of each step is one-half the distance to 0 or to 1, whichever is nearer. In other words, the distance moved is 1/2 min(x, 1–x).
If you want to know more about this process and why I bothered to write about it, please see the column. Here I just want to say a few words about visual aids that might be helpful in understanding how the random walk evolves and where the walker is likely to wind up.
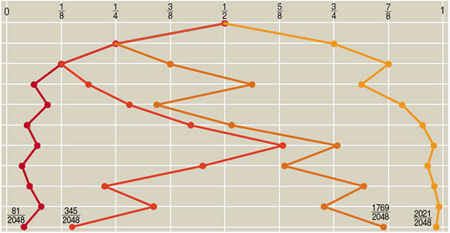
Here is one of the illustrations that appears in the column:

We see four trajectories, each lasting 10 steps. Although the walk is actually one-dimensional—moving back and forth along an interval of the x axis—the trajectories are plotted in two dimensions for clarity, moving down the page so that the illustration becomes a kind of discrete spacetime diagram. Even with this device, though, some of the paths overlap for part of their course. If I tried to crowd more trajectories into the figure, the overlaps would make it hard to sort out one walk from another.
In making pictures like this, the issue is not just how you explain an experiment to other people; it’s also a matter of how you come to understand the process yourself. While I was trying to make sense of the Zeno walk, I plotted lots of trajectories like these, initially by hand and then with a program that generated Postscript files. Some important features were quickly apparent. In particular, I noticed that the walker takes much bigger strides in the middle of the space than near the edges. (Of course this fact follows directly from the definition of the walk, but it doesn’t hurt to see a picture.) I also observed that most of the walks seem to spend most of their time hugging one edge or the other, seldom venturing back across the midline of the space. Even after looking at a few hundred examples, however, I didn’t feel like I had a really secure sense of how a “typical” walk would proceed.
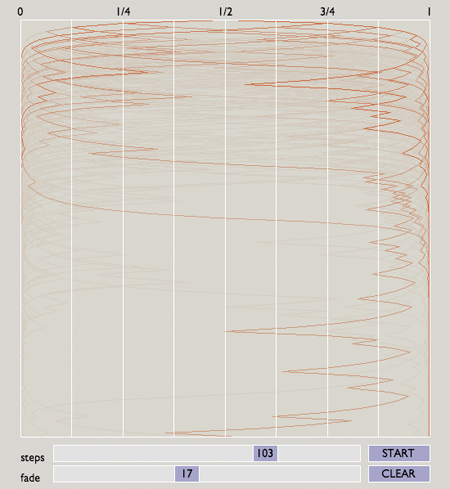
As with many processes that evolve over time, the illustrative possibilities are much richer if we can escape the static bounds of ink on paper. And thus I was led to try creating a more dynamic and interactive display.

What you see above is not dynamic; it’s merely static pixels on glass. But you can see it all in action in this Java applet. Feel free to click on the link and go play, but do come back here afterward so we can continue the conversation.
Hello again.
Does this program succeed in conveying an intuitive sense of how the Zeno walker walks? Personally, I’ve found it helpful, although it still comes up far short of ideal. Adjusting the number of steps in each walk gives a sense of how the walker’s apparent attraction to the edges gets more extreme over time. And adjusting the rate at which paths fade into the background allows for a degree of balance between clutter and evanescence. But there may well be a better way to go about visualizing these concepts. I’d be interested in hearing suggestions.
A note on the implementation: The applet was created with the programming language called Processing, invented by Ben Fry and Casey Reas. I’ve just reviewed two books on Processing, and so this project was undertaken partly to try out the language and its programming environment. I found it very slick, and mostly trouble-free. The source code of the zenowalk program is available through a link on the applet page. (Most of the code for the buttons and sliders was cribbed from the book by Fry and Reas.)
Of course there’s always something lacking in any programming language. In this case what I missed most acutely was the exact rational arithmetic I rely on in Lisp. Processing has only single-precision floating-point numbers. In the Zeno walk, these numbers begin running out of significant digits after about 150 steps (which is why I limited the program to 145 steps). As far as I can tell, no one has yet written a Processing library for bignums and exact rationals. I guess that’s my job.