I have a longstanding friendly feud with my Editor-in-Chief over the use of logarithmic scales in graphs. I tend to go for a log plot if there’s the slightest hint of an exponential trend in the data; she argues that the human sense of numbers is inherently linear, and thus a nonlinear scale should be used only in exceptional circumstances. Linear is natural, she says; logs are for geeks.
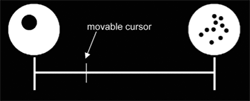
 Vindication is always sweet, so I was delighted to see a report in the latest issue of Science (subscription needed for full-text access) suggesting that members of an Amazonian indigenous group seem to order numbers on a logarithmic scale. Stanislas Dehaene, Véronique Izard, Elizabeth Spelke and Pierre Pica worked with 33 adults and children of the Mundurucu group in Brazil’s Para province. The subjects were shown a line segment with labeled end points (illustration above) and asked to place various other numbers within this interval. The numbers were presented as patterns of dots, as sequences of tones or as spoken number words in the Mundurucu language or in Portuguese. The results of the experiment show, according to Dehaene et al.:
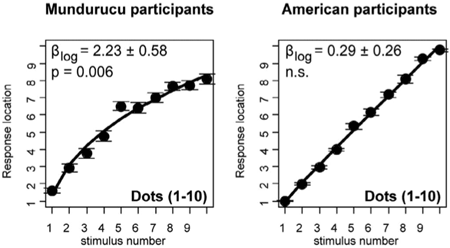
The Mundurucu seem to hold intuitions of numbers as a log scale where the middle of the interval 1 through 10 is 3 or 4, not 5 or 6.
In contrast, 16 American control subjects from the Boston area placed numbers on the scale pretty much in proportion to their magnitude.

For the sake of my ongoing quibble with the E-in-C, it’s in my interest to support and endorse this finding. I wish could do so.
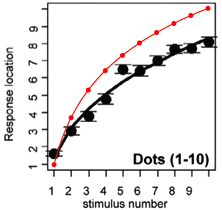
 Exactly what does it mean to “hold intuitions of numbers as a log scale”? Simply taking base-10 logarithms of numbers isn’t quite what’s wanted. The logarithm function maps the integers 1 through 10 onto a range from 0 to 1. To map numbers in the domain [1, 10] onto the same co-domain “logarithmically,” we need a transformation along the lines of R = (9 log10 S) + 1, where R is the “response location” and S is the “stimulus number.” But the resulting curve, superimposed in red on the graph above, doesn’t match the experimental data very well at all. And, looking at the data more closely, it’s hard to see how any plausible transformation is going to account for the positions of those dots and error bars. There’s trouble in the middle, where 5 was judged larger than 6. And there’s trouble at both ends: No matter where you place the numbers 2 through 9 on the scale, shouldn’t 1=1 and 10=10? The anomalies at the ends are made more puzzling by the instructions given to the test subjects:
Only two training trials were presented, with sets of dots whose numerosity corresponded to the ends of the scale (1 and 10). The participants were told that these two stimuli belonged to their respective ends, but that other stimuli could be placed at any location.
In view of these instructions, it seems peculiar that stimulus number 1 has a response location near 1.5, and stimulus number 10 corresponds to a response location of roughly 8.
I wonder if the data aren’t better explained by a simple step function. Perhaps the subjects counted dots up to 4, but beyond that merely estimated the number of spots, lumping together any stimulus with 5, 6 or 7 dots in one class, and putting patterns of 8, 9 or 10 spots in a second class.
Or maybe the arrangement is logarithmic after all. The Mundurucu may have a lot more mathematical sophistication than Dehaene et al. give them credit for. When presented with a scale that runs from 1 to 10, rather than 0 to 10, they intuit that the interval belongs to the series …, 0.01, 0.1, 1, 10, 100,…, rather than the more prosaic series …, –10, 0, 10, 20, 30, …. Anyway, I think that’s what I’ll tell my Editor-in-Chief.