
Before I put my toys away, here are two more views of continental divides. First, a broader look at North America, seeing it as more than a bicoastal continent. The southernmost incursion of the Arctic watershed is in the Red River valley, along the Minnesota-Dakota border.
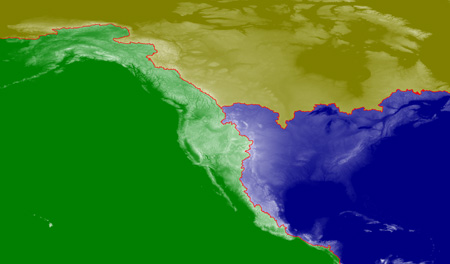
The map is based on NGDC data with 2-arc-minute resolution. Here’s a detail of the triple junction point:
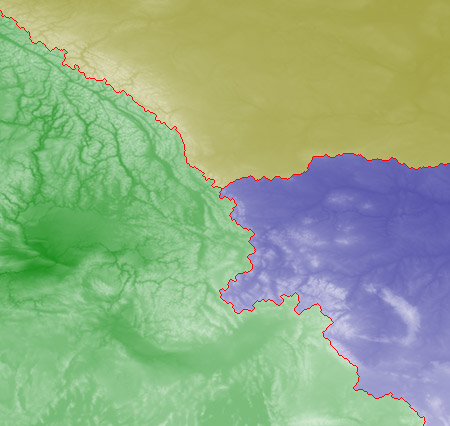
The calculated location of the ‘Y’ seems to correspond quite closely to Triple Divide Peak, in Glacier National Park in northwestern Montana. (The three streams flowing away from this peak are Atlantic Creek, Pacific Creek and Hudson Bay Creek.)
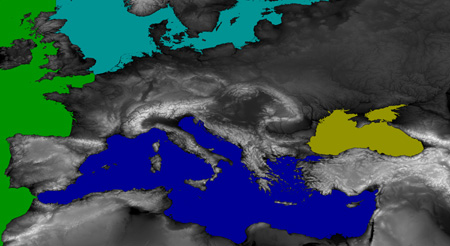
Second, I’ve done Europe, shown below in views before and after the flood. (For these maps I’ve done some terraforming, plugging up the Straits of Gibraltar and the Bosporus and erecting a barricade between the Atlantic and the North Sea. The base map is at 1-arc-second resolution.)
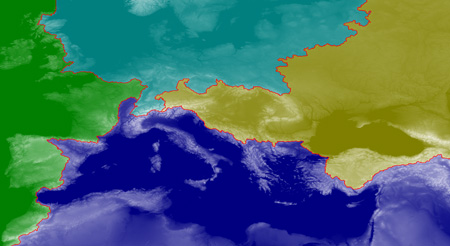
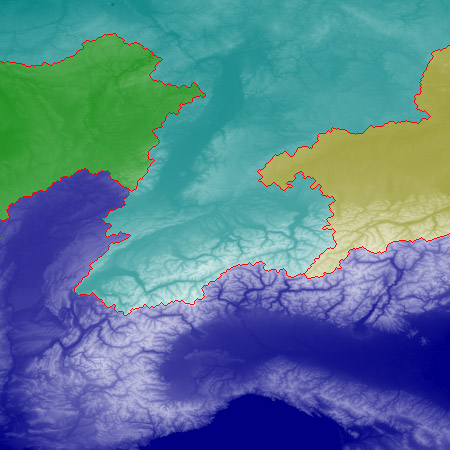
Finally, below, here’s a detail of the Alpine region where waters diverge toward all four points of the compass.
I see Andy Martin has been talking prominence with you. I’ve hiked to that triple divide point in Europe (the Eastern one) its at a location called Pass Lunghin, near Maloja Switzerland. I’ve played with divide trees and ridge lines for years as you will see on peaklist.org. The challenge with the flood model is that the watersheds are a function of the shape of the coastline. In other words, the divides are defined by the oceans. I’ve often wondered how you could come up with a mathematically robust definition of ridge lines and divide trees that are independent of the shape of the coast. Great images by the way.
The website peaklist.org, which Aaron M. refers to in the comment above, has an extensive discussion of divides and watersheds, seen from a very different point of view—as a framework for ranking peaks rather than for tracing drainage patterns. The concept of prominence that Aaron mentions is defined as follows:
The quote comes from Aaron’s essay on “Prominence and Orometrics.” See also a map of the western U.S. that includes not just the Great Divide but also a “divide tree” branching out from it.
But, Aaron, I don’t really understand your comment that in the flood model “watersheds are a function of the shape of the coastline.” How so? I could add any number of wiggles to the U.S. coastline without changing the computed divide.
Aaron mentions that continental divides depend on the shape of the coastline and, more importantly, the labeling of the oceans. Peaklist.org has a great introduction to prominence that I think can be applied to defining oceans. What you could do is essentially invert the map and find the prominence of the deepest pits in the oceans. The contour line from its key saddle around each pit would trace the waterline if it was filled up to overflowing. Using this method, you could define a threshold of prominence and build a tree of pits for the entire world. You could just label each pit as an ocean then, and you’d have a unique way of defining all the continental divides that depends only on the threshold of prominence for the ocean pits.
It seems to me that a lot of the boundaries between oceans are places where there are straits - narrow passages of water, with a small cross-sectional area. I wonder if there is a way to build a tree of all the channels on the map, keeping at every point on a channel the minimum cross-sectional area between sea level and the bottom of the channel. You could use this tree to find the points of minimum cross-section to partition the oceans. Probably points like the Strait of Gibraltar and the Strait of Magellan would be great candidates for ocean boundaries under this scheme.
But any such algorithm would have to be able to partition using multiple channels at once, or else the first partition wouldn’t make two oceans. If you cut at the Strait of Magellan, the Pacific would still stretch the other way around the world and meet itself on the other side. If you could find a tractable way of searching for candidate sets of straits, you could just pick those sets where the total cross-sectional area of the straits is less than some ratio of the volume of the smaller body of water after the partitioning.
Now that I think more about it, why does the cross-sectional area even matter? You could just use the minimum width of the strait. In fact, there is a nice way of representing a two-dimensional area that might make finding straits easier. It’s called a Voronoi graph or Voronoi diagram. If you smoothed the map a little you could construct a Voronoi graph of all the oceans, and then finding the boundaries between oceans is just a matter of partitioning that graph.
brian - I think Aaron’s point was that the boundaries of the oceans are not mathematically defined; they are labels given to vague expanses of water, and the divisions between bodies of water do not follow any consistent rules. Using the human divisions between bodies of water means you have to mark the water areas of any map with labels and boundaries if you want to construct continental divides based on the labels. It’s a lot nicer to have a mathematical definition of bodies of water.
As for my previous suggestion of building a graph of the oceans and straits, I realized it’s NP-complete (it’s exactly the weighted graph partitioning problem). Oh well.
Switzerland controls the water of Europe. I wonder how the moon would divide up?
@Sam S.: A divide tree that links ocean trenches to mountains peaks is a fascinating idea. I’m not going to be able to explore the process myself anytime soon, but if someone else gives it a try, I’d be really interested in seeing the result.
As for finding a mathematically sensible rule for drawing boundaries between the oceans, it seems hopeless to me. It’s all mere human convenience and convention. Anyway, why bother: The world will look very different in a few hundred million years.
Sam said it right. There is really just one ocean in the world after all. If you look at your image of the continental divide in Alaska, it merely leads to the narrowest part of the Bering Strait. The divide leading to the Aleutians is an equally plausible divide. So your divide (which is the conventional one) is really a function of the shape of the coastline.
Part of my inspiration for writing the article referenced above was trying to understand the “logic” of the divide tree, independent of watersheds and oceans. The divides that you show in your images are the central spines of a very complex divide tree, but I never got so far as to express their primacy without somehow referencing the watersheds whose boundaries they represent.
I would like to share some images of how the Earth would be divided if you use ocean trenches and deep basins for the drainage areas instead of pre-defined oceans. I wrote a Java program that finds all basins at least 1000m deep and builds a divide tree based on them. You can see the images at http://picasaweb.google.com/sam.sonne/Divides
I implemented this by first sorting all the tiles on the map by elevation (which was the hardest part — there are 233 million!). Then I iterated over every tile from the lowest first. If the current tile appears next to an existing basin, it is added to that basin. If it stands alone, a new basin is created. If it borders two or more other basins, if any are less than 1000m deep then the deepest floods it and they are combined. If there are two or more adjacent tiles that belong to basins more than 1000m deep, then it lies on a divide. That’s it!
I used a random number generator to assign the basin colors, which is why some of them look so funky. There are some basins that have nearly the same color and share a border (in Greece for instance) as well.
If anyone would like other details from the map, I am happy to provide them. This turned out looking much cooler than I expected.
Sam: Fabulous and fascinating! Thanks so much.
I have a bunch of questions, which you may or may not be interested in trying to answer. I’ll just dump them here, and you can respond if and when it’s convenient.
How many basins are there in your map? Do you have any measurements of the size distribution? Or at least can you identify the largest? Was the 1,000-meter threshold just an arbitrary choice, or did you experiment with other values?
It’s interesting (though perhaps it shouldn’t be surprising) that the most prominent divide on the planet appears to be the mid-Atlantic Ridge.
There is a branch of topology called Morse-Smale theory which provides a way to define drainages and divides in a manner that is both theoretically/mathematically elegant in an intellectual sense and robust/useful in a practical sense. To determine the Morse-Smale topology of a landscape, simply identify all the peaks, saddles, and basins; then trace the gradient uphill from each saddle until you reach a peak, and downhill until you reach a basin or ocean.
My Winprom program implements this method to calculate prominence, and one by-broduct of this method is that you get a divide tree out of it. The algorithm is quite efficient, and its computational cost is simply O(N) in the number of elevation grid points. [Actually, when it encounters a large flat area such as a body of water, it is O(N log N) in the number of grid points in the flat area, but that's still very acceptible.]
If the elevation grid point interval is fine enough that you can’t store it all at once for the whole world or a whole continent you’re interested in, you can run the algorithm to generate divide trees in a piecemeal matter tile-by-tile, then splice the resulting divide trees together.
There is also an elegant and useful way to define a divide tree for an archipelago in a flat body of water, based on the shortest possible distance across the water between islands. Meaningful, objective ocean boundaries can be based on this concept. For a discussion of it, see my post to the prominence group in May 2008:
http://groups.yahoo.com/group/prominence/message/4849
I picked the 1000m threshold after experimenting with one other value, 100m. 100m produced way too many basins (the whole map looked like static) and I tried 1000m, and that looked about right. The iteration time for one run is so long that I didn’t want to spend the time trying different values (one run takes over an hour, and my computer is unusable during that time).
I measured the deepest basin, and it’s the one running from the Himalayas down through Bangladesh and into the Indian Ocean. It’s the purplish one in the southern portion of this image:
http://picasaweb.google.com/lh/photo/753ZLUwOxcXG2UonnKBBHw?feat=directlink
It starts at 6294m below sea level and goes all the way up to 8333m at the top of the Himalayas, for a total of 14627m.
I have to do another run to get the average size and average depth of these basins (bear in mind that they’re bounded below at 1000m so that will skew the average depth).
Edward, that was a very interesting comment about Morse-Smale theory. I hadn’t really thought about this problem in those terms, but after you mentioned it I see how it fits exactly. The method I used to divide the earth into basins is equivalent to passing a horizontal plane up through the map. At a given elevation, wherever the plane intersects the ground you can draw lines like the contours on a topographic map. Any one of these lines is connected to itself and encloses a space, which is a basin or a peak. Whenever a new curve appears as you move the plane upwards, you’ve found the bottom of a new basin. Wherever two curves merge or one splits into two, you’ve found a saddle point. And where a curve shrinks to nothing and vanishes, is a mountain peak.
How does your WinProm program avoid the ‘noise’ that you find in a map, where there are tons of minor critical points in any reasonably hilly area?