
The question again: Is there a four-coloring of the 17-by-17 grid in which none of the 18,496 rectangles have the same color at all four corners? As I said last time, Bill Gasarch would not have put a bounty on this problem if it had an easy solution. Over the past couple of weeks I’ve invested some 1014 CPU cycles in the search, and a few neural cycles too. I have nothing to show for the effort, except maybe a slightly clearer intuition about the nature of the problem.
If you generate a bunch of four-colored n-by-n grids at random, the average number of monochromatic rectangles per grid increases quite smoothly with n:
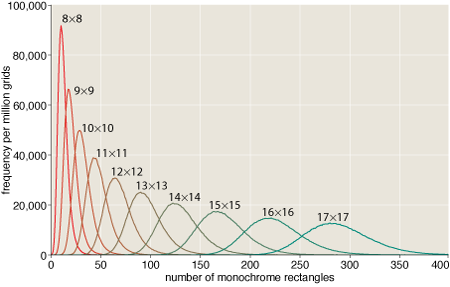
This gradual progression might lead you to suspect that the difficulty of finding or producing an n-by-n grid that is totally devoid of monochrome rectangles would also be a smooth function of n. The truth is quite different.
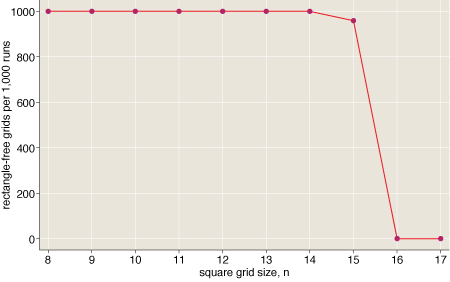
Finding a solution is easy for square grids of any size up to 15 by 15. The task suddenly becomes very hard at size 16 by 16. As for 17 by 17, it’s much harder still–and indeed is not yet known not to be impossible. (Details on the data behind this graph: For each size class from n=8 to n=17 I started with 1,000 randomly four-colored n-by-n grids. Then I applied a simple heuristic search (the first of the algorithms listed below) to each grid, running the program for 1,000 × n2 steps. The graph records the number of times this procedure succeeded–i.e., produced a grid with no monochrome rectangles–at each grid size. Up to n=14, the search never failed; at n=16 and beyond, it never succeeded.)
This kind of sudden transition from easy to hard is a familiar feature in the realm of constraint satisfaction. Well-known intractable problems such as graph coloring and boolean satisfiability have the same structure. That doesn’t bode well for any of the simple-minded computational methods I’ve tried. Here’s a brief catalog of my failures. These are algorithms that I’m pretty sure are never going to pay off.
- Biased random walk. Start with a randomly colored grid. Repeatedly choose a site at random, then try changing its color; accept the move if it reduces the overall number of monochrome rectangles. This is the simplest of all the algorithms. None of the more-elaborate schemes is decisively better.
- Whack-a-mole. Find all the monochrome rectangles in the grid; choose one of them and alter the color of one corner, thereby eliminating the rectangle. In the simplest version of this algorithm, you choose the rectangle and the corner and the new color at random; in more sophisticated versions, you might evaluate the alternatives and take the one that offers the greatest benefit.
- Steepest descent. Examine all possible moves (for the 17-by-17 grid there are 867 of them) and choose one that minimizes the rectangle count.
- Lookahead steepest descent. Examine all possible moves, and then all possible sequels to each such move (for the 17-by-17 grid there are 751,689 two-move sequences); choose a sequence that minimizes the rectangle count. In principle this method could be extended to chains of three or more moves, but the cost soon gets out of hand. (The lookahead technique is the mirror image of backtrack search; it explores the tree of possible moves breadth-first instead of depth-first.)
- Color-balanced search. Allow only moves that maintain the overall balance of colors in the grid. For example, in a 16-by-16 four-colored grid, color balance implies 16 sites in each color. One way to maintain balance is to make moves that swap the colors of two sites. (There is no reason to think that a rectangle-free grid will have exact color balance; on the other hand, a solution for a large grid cannot depart too far from perfect balance. Thus a color-balanced search might be an effective trick for finding a neighborhood where solutions are more common.)
- Row-and-column-balanced search. Allow only moves that maintain the balance of colors within each row and each column of the grid. In a 16-by-16 grid, each row and column should have four sites in each of four colors. A simple way to maintain this detailed color balance is to search for “harlequin rectangles” with the color pattern \(\begin{array}{cc}a & b\\b & a\end{array}\) and permute them to \(\begin{array}{cc}b & a\\a & b\end{array}\).
Most of these techniques are greedy: At each stage the algorithm chooses an action that maximizes some measure of progress. On hard instances, a pure greedy strategy almost always fails; the search gets stuck in some local optimum. Thus it’s usually best to temper the greediness to some extent, occasionally choosing a move other than the one that yields the best immediate return. (The family of methods known as simulated annealing are more elaborate variations on this idea, based on insights from thermal physics.)
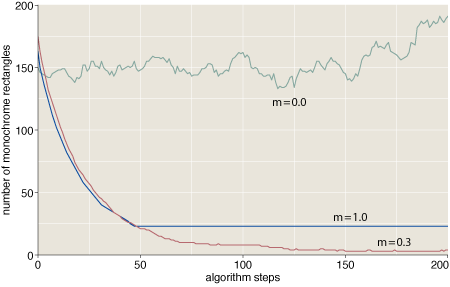
Here we see traces of three runs of the algorithm identified above as steepest descent, with differing values of a greediness parameter m. (The grid size is 15 × 15.) At m=0 (no greediness at all), all moves are equally likely to be chosen, and the algorithm executes a random walk on the space of grid colorings. At m=1 (maximum greediness), the program always chooses the highest-ranked move, which works well until the system stumbles into a state where no move can reduce the rectangle count. A value of m=0.3 seems to be a good compromise. (I’ll say a little more below on the greediness parameter; indeed, I have a question about how best to define and implement it.)
After all this fussing with a dozen variations on local-search algorithms, I’m afraid the outlook for success is not promising. With a little patience and some tuning of parameters, any one of these algorithms can solve grids up to 15 × 15. With a lot more patience and tuning, they’ll eventually yield answers for 16 × 16. But none of the algorithms come even close to cracking the 17 × 17 barrier. Solving that one is going to require a fundamentally new idea. Perhaps someone will find an analytic approach to constructing a solution, rather than blindly searching for one. Or perhaps someone will prove that no solution exists.
On the computational front, I suspect the best hope is a family of algorithms known in various contexts as belief propagation, survey propagation and the cavity method. I’ve been hoping that friends who are expert in these techniques might swoop in and solve the problem for me, but if not I may have to give it a try myself.
In the meantime, here’s the thing about greediness (an apt subject for this time of year?). We want to define a function greedy whose arguments are a vector of alternative moves ranked from best to worst and a number m such that 0 ≤ m ≤ 1. If the greediness parameter m is 0, the function returns a random element of the vector. If m = 1, the returned value is always the first (highest-ranked) move. Otherwise, we must somehow interpolate between these behaviors. One attractive notion is to return the first element of the vector with probability m, the second choice with probability m(1 − m), and so on. Thus for m = 1/2 the series of probabilities would begin 1/2, 1/4, 1/8…. For m = 1/3 the first few values are 1/3, 2/9, 4/27….
This scheme works just fine for a vector of infinite length, but there’s a problem with shorter vectors. Consider what happens with the procedure call greedy(v=[1, 2, 3, 4], m=0.5). We have the following table of probabilities:
     1 --> 1/2
     2 --> 1/4
     3 --> 1/8
     4 --> 1/16
But on adding up those values, we come up 1/16th short of 1. What happens to the missing probability? I took an easy way out, distributing the “extra” probability equally over all the elements of the vector. The code looks something like this:
function greedy(v, m)
  for i=0 to length(v)
     if (i==length(v))
        return v[random(length(v))]
     elseif (random(1.0) < m)
        return v[i]
This procedure seems to give sensible results, but I wonder if there might be a better or more natural definition of greedy probabilities. Also, the running time for my code is logarithmic in the length of the vector (assuming m < 1). Is there a constant-time algorithm that gives the same results? (We don't know the length of the vector in advance, so merely precomputing the table of probabilities is not an option.)
Typically to get a precise random distribution you have to retry whenever you end up in that last remaining bit of probability. Any other solution tends to introduce subtle biases.
function greedy(v, m)
while (true)
for i=0 to length(v) - 1
if (random(1.0) < m)
return v[i]
I came up with a constant time solution to find the random index, although it suffers from the last bit problem so you still need to retry. Use this formula to calculate the index and retry whenever you get an index greater than the array length.
i = floor(log(random(1.0), 1-m))
Where log(x, b) returns the log of x with a base b.
Another good kind of partly-greedy search is RRT, for “record-to-record travel”. It’s a bit like simulated annealing, but is less physical. There is a “tolerance” parameter d, and we keep track of MinSoFar, the smallest number of defects we have achieved so far in the search. At each step, you choose a random move, and do it—as long as the resulting number of defects does not exceed MinSoFar+d. Pekka Orponen did extensive studied of RRT on random SAT—it works quite well.
For randomized variants of greedy algorithms, see the paper on “BubbleSearch” by Lesh and Mitzenmacher (easily found online).
“We don’t know the length of the vector in advance, so merely precomputing the table of probabilities is not an option.”
Why can’t you just precompute the weights for all vector lengths [1..100] and cache/lookup those?
You can always just cycle from the bottom back to the top — that is, if you fail all the way to the bottom, start over at the top again. This preserves the right “ratios” among the probabilities.
I can’t imagine this step is the bottleneck. Even if you proceed from the top greedily, on average you just need a constant number of steps for each greedy call to find the right rank of the move. Better to spend your thought cycles elsewhere?
And you should look at the paper on Bubblesearch by myself and Neal Lesh, which uses this kind of greedy algorithm repeatedly as a heuristic randomized greedy algorithm…
Thanks for several helpful comments. I’m at a rest stop on the NY Thruway at the moment and can’t offer much in the way of thoughtful responses, but, hastily….
The greedy random choice is not a bottleneck. I simply found it an interesting puzzle that might well have an elegant solution.
Precomputing the probabilities might be a practical option in many circumstances, but in this case the vectors can be fairly long (maybe 18,000 elements). Not elegant.
Record-to-record is a new one to me. Thanks for the pointer.
On Mccoyn’s first greedy function: Does this give the right answer (and does it terminate) in the case of m=0? Mccoyn’s second function deserves more careful attention that I can manage on the Thruway.
Thanks again. More later.
My first function is not guaranteed to terminate, but it probably will, given enough time. The expected value for the runtime (the number of times random is called) is 1*m + 2*(1-m)m + 3*(1-m)(1-m)m + … This works out to 1/m. So, for m = 0.5, this is only 2 calls to random, on average. It does not degrade gracefully for small values of m. For m=0.01 it will take 100 calls to random. For m = 0, it will in theory never terminate although since random returns a discrete value it will eventually terminate, though likely only after a very long time.
I’ve come up with a couple improvements for the second function that will get rid of the need to retry.
The first idea is to modify the range passed to the random function so that the formula does not return a length greater than your list. You can invert the function to get the limit.
lowLimit = pow(1-m, length(v))
i = floor(log(random(lowLimit, 1.0), 1-m))
The second idea relies on the observation that the distribution among the last m elements of an n element list will be the same (relative to the total for the sublist) as the distribution among an m element list. That means that when the formula I came up with calculates a value for i that is greater than the list length, you can just subtract the list length from it rather than retrying the whole thing. Of course, you have to subtract the length repeatedly until you get down to the correct range because you might end up with a value for i that is greater than twice the list length. This is just the modulo operation.
i = modulo(floor(log(random(1.0), 1-m)), length(v))
This is a true constant time formula whose runtime does not degrade as you approach 0. Unfortunately, the log with a base of 1 doesn’t make much sense and so it won’t work for m = 0. For small values of m, it is likely that there will be so much wrap-around going on that some unexpected biases might appear due to the discrete values returned by random and the redistribution caused by log. The expected number of wrap-arounds would be 1/(length(v)*m). I’d say as long as this is less than 10 (to pick an arbitrary number) you should be fine.
I wish I could explain why the floor-log-random function works. I developed it by creating a spreadsheet that calculated a bunch of values and then experimented with ways to reverse it, mostly trusting on my instincts and the things I discovered along the way.
Here is why mccoyn’s floor-log-random function works.
If you have a random number generator that returns an infinite-precision uniformly chosen number between 0 and 1, you only need to call it once… Because it provides an infinite number of random bits. :-)
Let m be your parameter.
Then choose x at random between 0 and 1.
You seek an n satisfying:
m^(n+1) < x <= m^n
(This is obvious if you consider where the powers of m fall on the segment between 0 and 1.)
Logarithm is an increasing function, so take the log of all three, and recall that log(a^b) = b*log(a). Result:
(n+1)*log(m) < log(x) <= n*log(m)
Now divide through by log(m). m=1 is a special case that blows up — so treat it as a special case. When m < 1, log(m) log(x)/log(m) >= n
Therefore n = floor(log(x)/log(m))
Recall that log(x)/log(m) is log-base-m of x, and you get mmcoyn’s function. When m is a power of 2 — or more clearly, a power of 1/2 — this floor-of-log is just a fraction of the exponent on the floating-point representation. See frexp().
You have to start worrying about your double (or “long double”) precision when m gets too close to 0 or to 1. Details left as exercise for the reader…
OK something got scrambled there. I cannot seem to type what I mean without it getting interpreted as HTML markup…
I meant:
When m is-less-than 1,
n+1 > log(x)/log(m) >= n
…from which the floor-log solution follows.
Last attempt…
From:
(n+1)*log(m) < log(x) ≤ n*log(m)
When m < 1, log(m) is negative, so dividing through by it reverses the inequalities:
n+1 > log(x)/log(m) ≥ n
…and from there the “floor” formula follows immediately.
Wish we could edit these replies. Guess I need to be more patient and use the preview more…
Wow I need to lay off the egg nog.
Last try. For real. My previous explanation only works for m=0.5…
Let the indices start at 0. We want the probability of choosing index n to be m*(1-m)^n. (That is, skipping n indices and then not skipping the next.)
Choose x at random between 0 and 1. Find an integer n that satisfies:
(1-m)^(n+1) < x ≤ (1-m)^n
Observe that these intervals are disjoint for distinct n.
What is the probability of choosing a particular n? Since x is uniformly distributed between 0 and 1, that is just the difference between the left-hand and right-hand side of the above inequality… Which works out to m*(1-m)^n, as desired.
So now just solve the inequality for n. Take the log base 1-m — which is a decreasing function because 1-m is less than one, meaning the inequality gets reversed.
Result is mccoyn’s floor function, as desired.
Sorry for the multi-posting.
The probabilities proposed (m, m*(1-m), etc.) are a “geometric” distribution,
http://en.wikipedia.org/wiki/Geometric_distribution
though of course in this case it is truncated at the length of the vector. You can find an algorithm for generating a geometric random variable in a few places (e.g. “Introduction to Stochastic Models” by Sheldon Ross, no relation to the current comment author), but it boils down to mccoyn’s logarithm method. Essentially, you are generating an “exponential” random variable, the continuous cousin of the geometric, then making it an integer. Then there’s the mod to deal with the truncation to a finite-length list.
This idea of interpolating between the maximum element and a random element reminds me of the Lp norms,
http://en.wikipedia.org/wiki/Lp_space
I don’t understand the interest in this problem. It is at best a curiosity. If there is a solution, then it is probably hard to find and still isn’t very interesting. If there isn’t a solution, then it is probably extremely difficult to prove, and it remains uninteresting.
I guess the interest is because the problem seems so approachable. But proving the nonexistence of a solution is not very approachable.
I don’t think the 17×17 exits. I took all of the 15×15 I know about; 11 of them up rotation, reflection, and permutation of colors (RotReflPerm); and tried to sew them into 16x16s. I was able to sew 5 16x16s up to RotReflPerm. I failed to sew the 5 16x16s into a 17×17. So either my sewing is bad, or there is a 15×15 I don’t know about, or there is no 17×17. If you want to inspect the 15x15s and 16x16s for a pattern, I can email them to you.
I forgot about row and column permutations! I will add those in and keep sewing.
There has been some discussion of trying to reduce the search space by using symmetries. A comment to the prior blog entry pointed out that dividing the number of four color 17×17 grids which = 4^289 by the group of (17!)^2 symmetries one gets by permuting rows and columns did not make a significant reduction in the enormity of 4^289 as one can see using Stirling’s formula. So this approach was unlikely to be productive.
I agree but the symmetry question is interesting in and of itself even for smaller grids and fewer colors. What is interesting, is how many equivalence classes are there for a given grid size and number of colors. The first thing to notice is that there are more than the (17!)^2 symmetries from row permutations and column permutations as has been pointed out by a number of commentators. Jim Ward (Jan 8) mentions rotation, reflection, and color permutations. But now there is some overlap because one can obtain 1) reflection around a horizontal axis by permuting rows, 2) reflection about a vertical axis by permuting columns, 3) rotations by using reflections, and maybe even more. Thus multiplying (17!)^2 by no more than 96 new symmetries, making a negligible dent in the original problem.
The situation is even worse because for certain, maybe even most, equivalence classes the symmetries are not distinct. The size of each equivalence class is equal to the number of distinct symmetries it has.
So the number of equivalence classes will be greater than 4^289
divided by 96x(17!)^2.
For example in the smallest case, there are 16 2×2 grids of 2 colors and thus no more than 16 symmetries. But in fact there are 4 equivalence classes, with the following representatives.
00
00 has 2 members,
00
01 has 8 members,
00
11 has 4 members, and
01
10 has 2 members.
Which software have you used to generate the graphics?
@ Paulo Matos: The graphics software is all homemade. I do most of my computing in Lisp, and I’ve written a couple of Lisp programs for graphing the output. The Lisp routines generate Postscript figures, which I then open in Adobe Illustration and convert to PNG or JPEG for display on the web. This work flow actually made sense years ago, when the ultimate destination of the artwork was the printed page. Postscript was the ideal format then. These days the whole scheme seems pretty archaic and overcomplicated. I should rewrite the graphing routines to produce SVG — but somehow I never get around to it.
Trying to extrapolate a pattern, I looked for a 17×17 whose diagonal entries are identical, like this 16×16 below, but there is none.
{1, 1, 2, 1, 2, 2, 3, 3, 4, 3, 4, 4, 1, 3, 2, 4},
{4, 1, 1, 2, 1, 2, 2, 3, 3, 4, 3, 4, 4, 1, 3, 2},
{2, 4, 1, 1, 2, 1, 2, 2, 3, 3, 4, 3, 4, 4, 1, 3},
{3, 2, 4, 1, 1, 2, 1, 2, 2, 3, 3, 4, 3, 4, 4, 1},
{1, 3, 2, 4, 1, 1, 2, 1, 2, 2, 3, 3, 4, 3, 4, 4},
{4, 1, 3, 2, 4, 1, 1, 2, 1, 2, 2, 3, 3, 4, 3, 4},
{4, 4, 1, 3, 2, 4, 1, 1, 2, 1, 2, 2, 3, 3, 4, 3},
{3, 4, 4, 1, 3, 2, 4, 1, 1, 2, 1, 2, 2, 3, 3, 4},
{4, 3, 4, 4, 1, 3, 2, 4, 1, 1, 2, 1, 2, 2, 3, 3},
{3, 4, 3, 4, 4, 1, 3, 2, 4, 1, 1, 2, 1, 2, 2, 3},
{3, 3, 4, 3, 4, 4, 1, 3, 2, 4, 1, 1, 2, 1, 2, 2},
{2, 3, 3, 4, 3, 4, 4, 1, 3, 2, 4, 1, 1, 2, 1, 2},
{2, 2, 3, 3, 4, 3, 4, 4, 1, 3, 2, 4, 1, 1, 2, 1},
{1, 2, 2, 3, 3, 4, 3, 4, 4, 1, 3, 2, 4, 1, 1, 2},
{2, 1, 2, 2, 3, 3, 4, 3, 4, 4, 1, 3, 2, 4, 1, 1},
{1, 2, 1, 2, 2, 3, 3, 4, 3, 4, 4, 1, 3, 2, 4, 1}
If there is a 60% chance of a major earthquake striking in Haiti over the next thirty years, what are the odds of an earthquake striking Haiti over the next 2 years? How about the next week?
Are the odds for two years simply 1/15th of 60%, that is 4%? And are the odds for the next week simply 1/52nd of 1/30th of 60%– or is this not the way to calculate the answer? Or is there no way to calculate the probability of a single event occurring in a fraction of the 30 year period?
I recognize that this is not the best forum for a question like this, but I am a regular reader of you blog, and I hope that someone here can assistt a simpleton with such a simple, trivial problem.
I’ve been having a debate about this question with my girlfriend, neither of us can resolve it, and I can’t seem to find an answer to it on google (see: http://www.google.com/search?hl=en&q=%22probability+over+time%22&sourceid=navclient-ff&rlz=1B3GGGL_enUS353US354&ie=UTF-8).
Would anyone on this blog please help us with this?
I had this question answered over at Scott Aaronson’s blog… no need to address it.
Thank you!
Hello,
Let’s not beat around the bush here… I like doing my mathematics by hand.
Computers only need to be used when the paperwork becomes overwhelming. Computers should not be used when a pencil and paper will get the job done.
By hand, a high-school student should understand how to generate an enormous number of 17×17 4-colourings with FOUR monochromatic rectangles. There may be a proof that FOUR is a hard limit, so find it in this essay, and get your $289. It may also be possible that no such limit exists.
Allow me to demonstrate:
Step 1) Define 4 colour sets { A, B, C, D }, where each set contains each colour, but has nothing in common with the other sets. There are many such sets.
Example:
A = 0123
B = 1230
C = 2301
D = 3012
Step 2) Using { A, B, C, D }, construct a perfect 16×16 4-colouring, where each row has nothing in common with 3 rows, and ( 1 of each colour ) in common with the remaining 12 rows.
Example: 16×16 - A perfect 4-colouring.
0 - AAAA
1 - BBBB
2 - CCCC
3 - DDDD
4 - ABCD
5 - ACDB
6 - ADBC
7 - BADC
8 - BCAD
9 - BDCA
a - CABD
b - CBDA
c - CDAB
d - DACB
e - DBAC
f - DCBA
* I am ashamed about how long it took me to formalize these simple permutations.
Step 3) Group the rows with nothing in common together. There will be 4 groups, each containing 4 rows. This will guide Step 4.
Gp0 = { 0, 1, 2, 3 }
Gp1 = { 4, 7, c, f }
Gp2 = { 5, 9, a, e }
Gp3 = { 6, 8, b, d }
Step 4) Build a 17th column by assigning 1 colour to each Group. Simply choose the corresponding Gp#. Note that a perfect 16×20 colouring can easily be generated using this method.
Step 5) Build a 17th row by assigning 1 colour to each Column-Group with nothing in common. In the 17th row, each number represents 4 identical numbers. Notice how there will be a single position, which has not been assigned a colour, marked by X. When it gets assigned, it introduces exactly 4 mono-chromatic rectangles into an otherwise perfect 17×17 colouring. Behold the result:
0 - AAAA 0
1 - BBBB 0
2 - CCCC 0
3 - DDDD 0
4 - ABCD 1
5 - ACDB 2
6 - ADBC 3
7 - BADC 1
8 - BCAD 3
9 - BDCA 2
a - CABD 2
b - CBDA 3
c - CDAB 1
d - DACB 3
e - DBAC 2
f - DCBA 1
L - 0 1 23 X
* L = Last Row Number 17
Please do not give up hope just yet. If somebody would like to show me a 16×21 perfect 4-colouring, this might open the gates to the 17×17 perfect 4-colouring, because the 16×21 grid is the first format not easily plotted perfect by hand.
Mathematical Aside:
The “Apex Constraint Condition” - I define this condition to be a colouring where each row has exactly one position, of each colour, in common with EVERY other row.
I conjecture that an analytical proof for the (existence / non-existence) of a perfect 17×17 4-colouring will arise from a thorough investigation of colourings having the “Apex Constraint Condition”.
Here is the solution to an NP-Complete problem, known to actually have a valid solution: 10 Best 5×5 Boggle Boards - TWL06
http://www.pathcom.com/~vadco/deep.html
All the very best,
JohnPaul Adamovsky
PS - Contact me if you have questions - logarithm69@hotmail.com
Perhaps Rohan equates “unknown” with “by-hand”.
Here is the most simple explicit case:
01230123012301230
12301230123012300
23012301230123010
30123012301230120
01231230230130121
01232301301212302
01233012123023013
12300123301223011
12302301012330123
12303012230101232
23010123123030122
23011230301201233
23013012012312301
30120123230112303
30121230012323012
30122301123001231
0000111122223333X
* Think of a professional way to say: “Suck on it… Suck it long, and suck it hard.”
* The metric system, that’s right, I don’t have a job.
————————————————————————————–
Hello People,
Is the money real, or did I fall for a hoax?
Long story short. I’ve stumbled into a proof that 4 Monochromatic rectangles is the HARD-LIMIT minimum for a 17×17 4-Colouring.
Mathematics Required: High School - Basic Enumeration Techniques
STATEMENT: It is impossible to construct 5 rows in any 4-Colouring, which have nothing in common with each other.
PROOF:
r1 - 0
r2 - 1
r3 - 2
r4 - 3
r5 - X
* Filling X with any Colour will introduce a commonality in the set.
CONCLUSION:
Four sets of 4 rows with nothing in common is an absolute hard limit for a 16×16 perfect 4-Colouring. This represents a “Minimal Constraint Condition” for 16×16 Colourings. It can also be shown that the “Apex Constraint Condition” where every row has 1 position of each Colour in common with each other row is impossible to construct for a 16×16 grid, and trivial for a 16×20 grid.
T1 - Any 4-Colouring can only contain a maximum of 4 rows with nothing in common.
PROOF BY CONTRADICTION:
Proposition: A Perfect 17×17 4-Colourings Does Exist
Thus, this Colouring must contain a perfect 16×16 Colouring.
By T1, and demonstrated in above post, the Optimal 16×16 Perfect Colouring has 4 sets of 4 rows with nothing in common.
Even with this optimal arrangement, there will be 4 sets of columns with nothing in common, and there will be 4 row sets with nothing in common.
Each row and column set can therefore be assigned a unique Colour, which will be added to the 17th row and column respectively. Adding the 16-element-row and 16-element-column will then introduce ZERO monochromatic rectangles.
The final element in the Bottom-Right corner is marked with an “X”.
Leaving the “X” blank, even in the most optimal case, the 17th row, and 17th column have exactly 1 Colour in common with each other corresponding row or column.
Filling any Colour into position X will thus introduce exactly 4 monochromatic rectangles. Simply inspect the Enumeration examples in the post directly above this one…
The proposition is a logical flaw, because assuming it to be true, PROVES THAT IT IS FALSE!
Therefore, A Perfect 17×17 4-Colourings Does NOT Exist
PS - I prefer cash, so please find a colleague of yours that lives in Toronto, who can hand it to me, and then you can wire them the money.
PPS - I prefer not to deal with banks until I get a sincere-written-apology from CIBC for claiming that they saved my life by emptying the $5000 in my account, while I was in a 25 day-long coma. I saved up that money working construction to pay for a trip to find a merit-based Aerospace Engineering job. I’m pretty sure that bankers aren’t in the business of saving lives, and I don’t give up, so I am still unemployed.
PPPS - I’m thinking this was a hoax, because I doubt that a tenured computer scientist would have any trouble putting together this bush-league high-school proof after a thorough and systematic investigation. I’ve recovered from massive head trauma, so even if it was a hoax, I’d at least like some peer review, and then my money in cash.
PPPPS - I also wrote an extremely powerful search algorithm in C with meticulous and space-saving record keeping, so as to completely eliminate cyclic redundant analysis, while being extremely greedy. Row isolated deviations allowed my quad core to analyse 2,733,499,642,000 of the best colourings in 9 hours and change. The program tanks out at 4 monochromatic rectangles, moves around the 6 to 10 space, and finds the next closest 4-mono-Colourings (typically 20 of them).
5 Monochromatic Rectangles are never found.
Maybe put out a bounty to prove that they don’t exist.
Either your intuition was way off, and-or you’re a stooge.
All the very best,
JohnPaul Adamovsky