JMM Notes and Snippets
by Brian Hayes
Published 10 January 2008

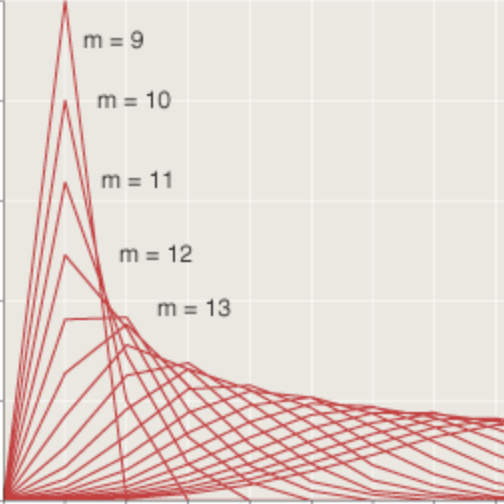
From the listener’s point of view, the utility curve for mathematics talks seems to look something like the plot at right. If you already know everything about a subject before you walk into the room, you’re not likely to learn much. At the opposite extreme, if your prior knowledge is absolutely zero, it’s again all too likely that you’ll remain just as ignorant afterwards as you were before. The existence of a peak between these zeroes is my optimistic hypothesis. (The nonexistence of regions where the function dips into negative territory is also asserted on faith, although I’m less sure about this. Over the years there have been a few talks where I felt I knew less at the end than at the beginning.)
I’ve had little experience with the know-it-all end of the curve, but I could give a fairly detailed account of what life is like near the ignoramibus end. In the past four days I’ve wandered into a a number of talks from which I was not equipped to profit—but there’s not much point in my discussing those. The paragraphs that follow are brief and hasty notes on some of the talks that taught me something.
Diffusion of knowledge
Steve Smale was one of the organizers of a session titled “The Mathematics of Information and Knowledge.” I went to Smale’s own talk in the session partly because it’s always worthwhile finding out what Smale has on his mind, but also because I was puzzled by that opaque and generic title. It might describe almost anything.
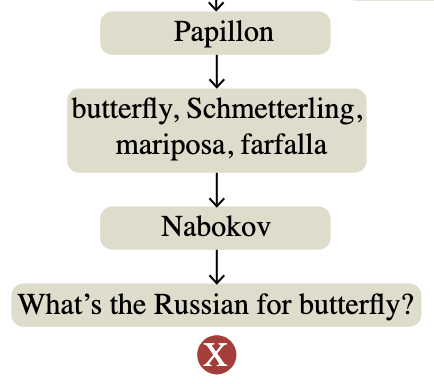
What Smale wanted to talk about was recent work on learning and vision, done in collaboration with Tomaso Poggio of MIT. Smale alluded to Noam Chomsky’s observations about “poverty of stimulus”: a child needs to see an elephant only once or twice to be able to recognize elephants forever after. Computational learning algorithms come nowhere near this level of efficiency; if you want a computer program to recognize elephants, you’ll need to show it many examples.
In their study of recognition algorithms, Smale and Poggio have chosen to work with simple grayscale images, which require less care and feeding than elephants. Their aim is to create a distance function that will measure the similarity of any two images, classifying them in much the way the human visual system does. For example, an image of a cat should be closer to another image of a cat than it is to an image of a dog. The ordinary Euclidean distance function is not much help here. If images have a million pixels, then each possible image is represented by a point in a million-dimensional space. The Euclidean distance between two such points doesn’t tell us much about cats and dogs; besides, there’s so much elbow room in a high-dimensional space that “closeness” doesn’t mean much. Some kind of drastic dimensional reduction is needed.
Image recognition algorithms have a long history, and techniques of dimensional reduction are a longstanding problem in statistics. What’s new here? Unfortunately, this is where I begin to slide down to the wrong end of the knowledge curve. What I’ve been able to piece together (both from Smale’s talk and from an earlier talk by Peter W. Jones of Yale) is that the key is to transform the problem into a new space that comes equipped with a new coordinate system and a new distance metric. The metric tries to measure distance based entirely on “local” information. Conventional similarity measures serve to determine which of the images are near neighbors, but then other methods define longer-range relations.
One such metric, called diffusion geometry, measures distance in terms of a random walk. In a database of images, for example, the distance between two images is the expected number of steps needed to get from one image to the other, taking each step by choosing a nearest neighbor at random. A benefit of this scheme is that it respects the structure of any clusters present in the population. Two images are close if there is one short path between them, but also if there are many long paths.
Techniques like these can be applied not only to image recognition but also to text mining, bioinformatics, internet search engines and doubtless other fields. Indeed, another aspect of the story came out in Fan Chung’s talk on the PageRank algorithm that search engines employ to match queries against web pages. It had never occurred to me that searching the web for the word “elephant” is so much like the process that goes on inside my head when I see and recognize an elephant. Perhaps this is what was so brilliant about the invention of Google: the search engine doesn’t really search (in the sense of sequentially considering all the possibilities); it recognizes.
Zeta functions of graphs
No sense pretending: I didn’t even know that graphs have zeta functions. I guess the celebrity of Riemann’s zeta function in number theory is so great that it has overshadowed other members of the family—at least for me. The Riemann zeta function involves a product of powers of all the prime numbers, but this is a concept that can be extended to other realms. In graphs, the analog of a prime number is a path that satisfies certain criteria: It must be “closed, backtrackless, tailless and primitive.” The graph-theory zeta function is defined in terms of these prime paths.
In number theory, the zeta function has a special place because it tells us something about the distribution of primes among the natural numbers. In particular, there’s a connection between the distribution of the primes and the positions of the zeroes of the zeta function (this is the Riemann Hypothesis). There’s a similar hypothesis in graph theory, although it concerns the “poles” rather than the zeroes of the zeta function. (A pole is a place where the function becomes infinite or undefined.) There may even be practical consequences of all this: The distribution of the poles affects the abundance of a special family of graphs called Ramanujan graphs, which have applications in computing and communication.
Audrey Terras and Wen-Ching Winnie Li both gave major talks on zeta functions of graphs. In addition, there were other sessions devoted to Ramanujan graphs and related topics.
Percolation
On this subject I thought I was at least near the middle of the knowledge curve, but I learned that I still have lots to learn.
The mathematical version of percolation has a connection to what happens in coffee pots and septic tanks, but it’s a pretty distant and abstract connection. The process happens on a lattice of some kind, such as a grid or a honeycomb. You color the nodes of the lattice black or white at random and then ask whether there’s a continuous path of one color that extends all the way across the lattice. In a four-sided lattice, if there’s a black path that extends all the way from the left edge to the right edge, then there can’t be a white path from top to bottom.
Percolation was a lively topic in the 1970s. (I’m fond of the problem in part because one of my own early experiments, when I first got my hands on a computer, was building a Lotus 1-2-3 spreadsheet to simulate percolation.) But I had thought that all the interesting questions had been settled by the early 1980s, especially in the work of Harry Kesten. Evidently not.
Wendelin Werner, the recent Fields medalist, gave the series of three Colloquium Lectures this year, and percolation was a major topic within his presentation. Greg Lawler, in a Current Events talk, also touched on the subject. On the final day of the meeting I heard another hour-long discussion of percolation by Gabor Pete.
The new twist that seems to have attracted this attention is the question of whether solutions to percolation problems are stable in the presence of noise or uncertainty. For example, if a lattice configuration has a percolating black path, what’s the probability that changing the color of a single site will destroy the path? It’s not hard to get approximate or experimental answers to questions like these—you might be able to do it with a spreadsheet—but the work reported here in San Diego is on the trail of exact and rigorous results.
The patron saint of hopeless problems
Jeffrey Lagarias has devoted no end of thought, labor and scholarship to problems that he acknowledges are “hopeless.” The best-known example is the 3X+1 problem: Iterate the map X → X/2 if X is even, X → (3X+1)/2 if X is odd, and determine whether the process always reaches the same terminal loop. In San Diego Lagarias spoke on another hopeless problem: “Basic ternary digit sets and associated tiles.” Given a set of digits, can you represent all real numbers by concatenating those digits? For standard digit sets such as {0,1} or {0,1,2} or{0,1,2,3,4,5,6,7,8,9}, the answer is yes. The set {–1,0,1}, known as balanced ternary, also works: It is said to be a “basic” digit set. But what about {0,1,π}? For this trio of digits, it can’t be done: No matter how you arrange the digits, there will be gaps on the number line that you cannot fill. The problem is deciding which digit sets are basic. Trying ternary representations of the form {0, 1 –q} yields a peculiar list of values of q for which the set is not basic. Trying to discover a formula that would generate that list of q‘s is now on the Lagarias list of hopeless problems.
Ringing up primes
This comes from a very diverting lecture by Brian Conrey on the Riemann hypothesis:
“The probability that an N-digit number is prime is approximately 1/(2.3N). For example, given a seven-digit telephone number, the probability is about 1/16. So, let’s try the experiment: How many of you have a prime phone number? (If only I were a little quicker at mental primality testing—gotta practice that Pollard rho algorithm—I could have raised my hand.)
The best of all possible lectures
Judith Grabiner spoke on the history of the idea of optimization in mathematics. Her story began with Heron of Alexandria, who explain the optical principle that the angle of incidence equals the angle of reflection by showing that this geometry yields the shortest path. Later, Fermat gave a subtly different rule for the law of refraction: The optimum path is the one that minimizes time rather than distance. Maupertuis then subsumed both of these ideas under the principle of least action. I have always found these laws of nature mildly mysterious. It’s not that I doubt their truth or applicability; my problem is that I don’t see why nature should “want” to minimize distance or time or action. Nature has all the time and space in the world—Where’s the need to be stingy with these resources.
Grabiner gave a thought-provoking review of the philosophical and theological background to these optimization principles. In this context it’s not hard to see a link between Leibniz’s work in the calculus and his optimistic philosophy, epitomized and satirized in the slogan “All is for the best in this best of all possible worlds.” In the world according to Leibniz, “God is the great optimizer,” and we should expect to find that the laws of nature are as simple as possible. Newton had a quite different but equally theological basis for his belief that the universe is ideally suited to human habitation. The question I’m left with, then, is how to account for the prevalence of optimization principles in the absence of such theistic underpinnings.
Sophie Germaine’s mathematical oeuvre
For me, this talk by David Pengelley was the big surprise of the meeting. Sophie Germain is perhaps the most famous of women mathematicians before the 20th century. But not one line of her own mathematical writing had been known; our only primary source was a footnote in a paper by Legendre. But now two great troves of letters and manuscripts have been uncovered in Paris and Florence, and suddenly we know that Germain was far more accomplished and ambitious than anyone had guessed. She had a full plan for proving Fermat’s Last Theorem; although it couldn’t have succeeded, it was a masterful attempt. As this story unfolds over the next few years—hopefully with publication of the papers—it’s going to be fascinating.
There’s lots more that’s worthy of mention, but it’s Thursday, the meeting is over, I’m at the airport in San Diego on my way home, and I’m exhausted. Happily, I can point out that I’m not the only one blogging this meeting. In particular, Adriana Salerno has been writing for the American Mathematical Society. (There’s a link on the AMS web site, but it’s well hidden; go here.)
Responses from readers:
Please note: The bit-player website is no longer equipped to accept and publish comments from readers, but the author is still eager to hear from you. Send comments, criticism, compliments, or corrections to brian@bit-player.org.
Publication history
First publication: 10 January 2008
Converted to Eleventy framework: 22 April 2025

My phone number is not prime.
How about dualistic underpinnings - perhaps there’s a god of optimization (female) at war with the god of entropy (male)? I got interested in male/female dichotomies while watching Thomas the Tank Engine with my toddler. How do we know steam engines have only two sexes? There could be as many as five. My phone number is divisible by 16.
The ordinary Euclidean distance function … in a million-dimensional space… doesn’t tell us much… there’s so much elbow room in a high-dimensional space that “closeness†doesn’t mean much.
This is important, and may be less widely understood than you think. I can readily grasp that the 747 which “on the map” appears to be about to hit me is in fact safely six miles up; in principle we should be able to extrapolate that to higher dimensionality, but in practice laymen rarely have occasion to do so. As I recall from undergraduate physical chemistry, even math-minded students had to work hard to get any feel for >3D phase spaces, ergodicity and all that.
So… I’d love to see an entire post (or column) devoted to this, pretty please.
On phone numbers: If Conrey had said to an audience of mathematicians, “Raise your hand if your phone number is not prime,” I hope that at least half the hands would have gone up!
@Jim Ward: I have a grandtoddler who is transfixed by Thomas the Tank Engine & friends. I would love to see a learned discourse on the sociology and psychology of this curious world (perhaps on the model of “The Physics of the Buffyverse”). But I’m not the one to write it. Don’t tell my grandkids, but I find Thomas insipid.
@Monte Davis: Thanks for the suggestion. I don’t know whether I have anything further to add. As a starting point, I should go back and reread Richard Bellman’s famous essay on “the curse of dimensionality.” I’ve just made a note to do so.
My phone number is prime, and my street address is 7!=5040. What are the odds of that?
Oops, my phone number is not prime. I typed “Factor[#]” in Mathematica, but you should use “FactorInteger[#]“. But my street address is a factorial.
I hope Bellman kicks off some ideas. I’ve occasionally tried to explain his “unit cube grows faster than unit sphere” insight with only fair-to-poor success, but you’re a much better explainer.
One place it crops up with a lot of resonance is in evolutionary thought, when you compare living species to all those that have existed… and then those to all possible phenotypes… and then those to all possible genotypes. It’s a useful mind-stretching exercise, changing one’s perspective from a Noah’s-Ark “plenitude” — gee, life seems to fill every niche — to a realization of just how sparse (mathematically speaking) the “tree of life” is.
I don’t see why nature should want.
May be the laws of nature have evolved to the form that we know.
In quantum mechanics, it’s possible to derive least-action principles by showing that all the paths in a superposition that don’t minimize some resource interfere destructively and cancel each other out. I really don’t understand this myself, but at least I felt like I understood it the several times it was explained to me; hopefully it’s enough of a hint to get you started.
My knowledge graph for talks looks different from yours: even if I already know “everything” about a topic, I often learn something from the way the speaker chooses to present the material; while on the left side, my graph is definitely not nonnegative.
Natural selection.
How long would any other universe with different laws have lasted?
Or may be there are others around?
Would those have developed this blog?
@Scott Aaronson: When I drew that silly graph, I had in the back of my mind the Laffer Curve. For those who don’t remember their Reagonomics, this was Arthur Laffer’s justification for reducing taxes on the rich. He noted that total revenue to the government would be zero at a tax rate of either o% or 100%, and so there “must be” a maximum somewhere between those extremes. He drew a curve that looked a lot like the one above. (Though I think maybe his was a parabola rather than a cosine curve.)
Martin Gardner (with help from Persi Diaconis) was one of the first to point out that the existence of a unique peak is not to be taken for granted. His Neo-Laffer Curve has a “technosnarl” in the middle. (A redrawn version here: http://en.wikipedia.org/wiki/Image:Neo-Laffer-Curve.svg)
Perhaps the real lecture-utility curve suffers from the opposite pathology: It is well-behaved in the middle but not very clearly defined at both ends.