My first encounter with the term algorithm did not come from Don Knuth. I learned it from the Internal Revenue Service. Sometime in the late 1960s or early 70s the IRS introduced a redesigned Form 1040 based on a principle borrowed from the world of computing: the algorithm. What this meant, I soon discovered, was that the wording of the instructions would be procedural rather than declarative. Instead of “Your tax is 15 percent of the amount on line 42,” we had “Multiply the amount on line 42 by 0.15 and write the result on line 43.” I had expected something more revolutionary, but at least I expanded my vocabulary.
I’ve filled out a lot of 1040s since then, but until yesterday I had never become acquainted with Schedule D (Capital Gains and Losses). What a treat I had waiting for me! Tucked inside the Schedule D instruction book, I found a marvel of labyrinthine arithmetic and logic. The tax worksheet on pages D-15 and D-16 might well be the most complex algorithm that ordinary people are ever asked to perform.
Below is my attempt to represent the worksheet as a data-flow diagram. Inputs (mostly dollar amounts copied from elsewhere in the tax return) are in blue; the eventual output (tax owed) is in red; the flow is mostly from bottom to top. The numbers in the boxes correspond to line numbers in the worksheet.
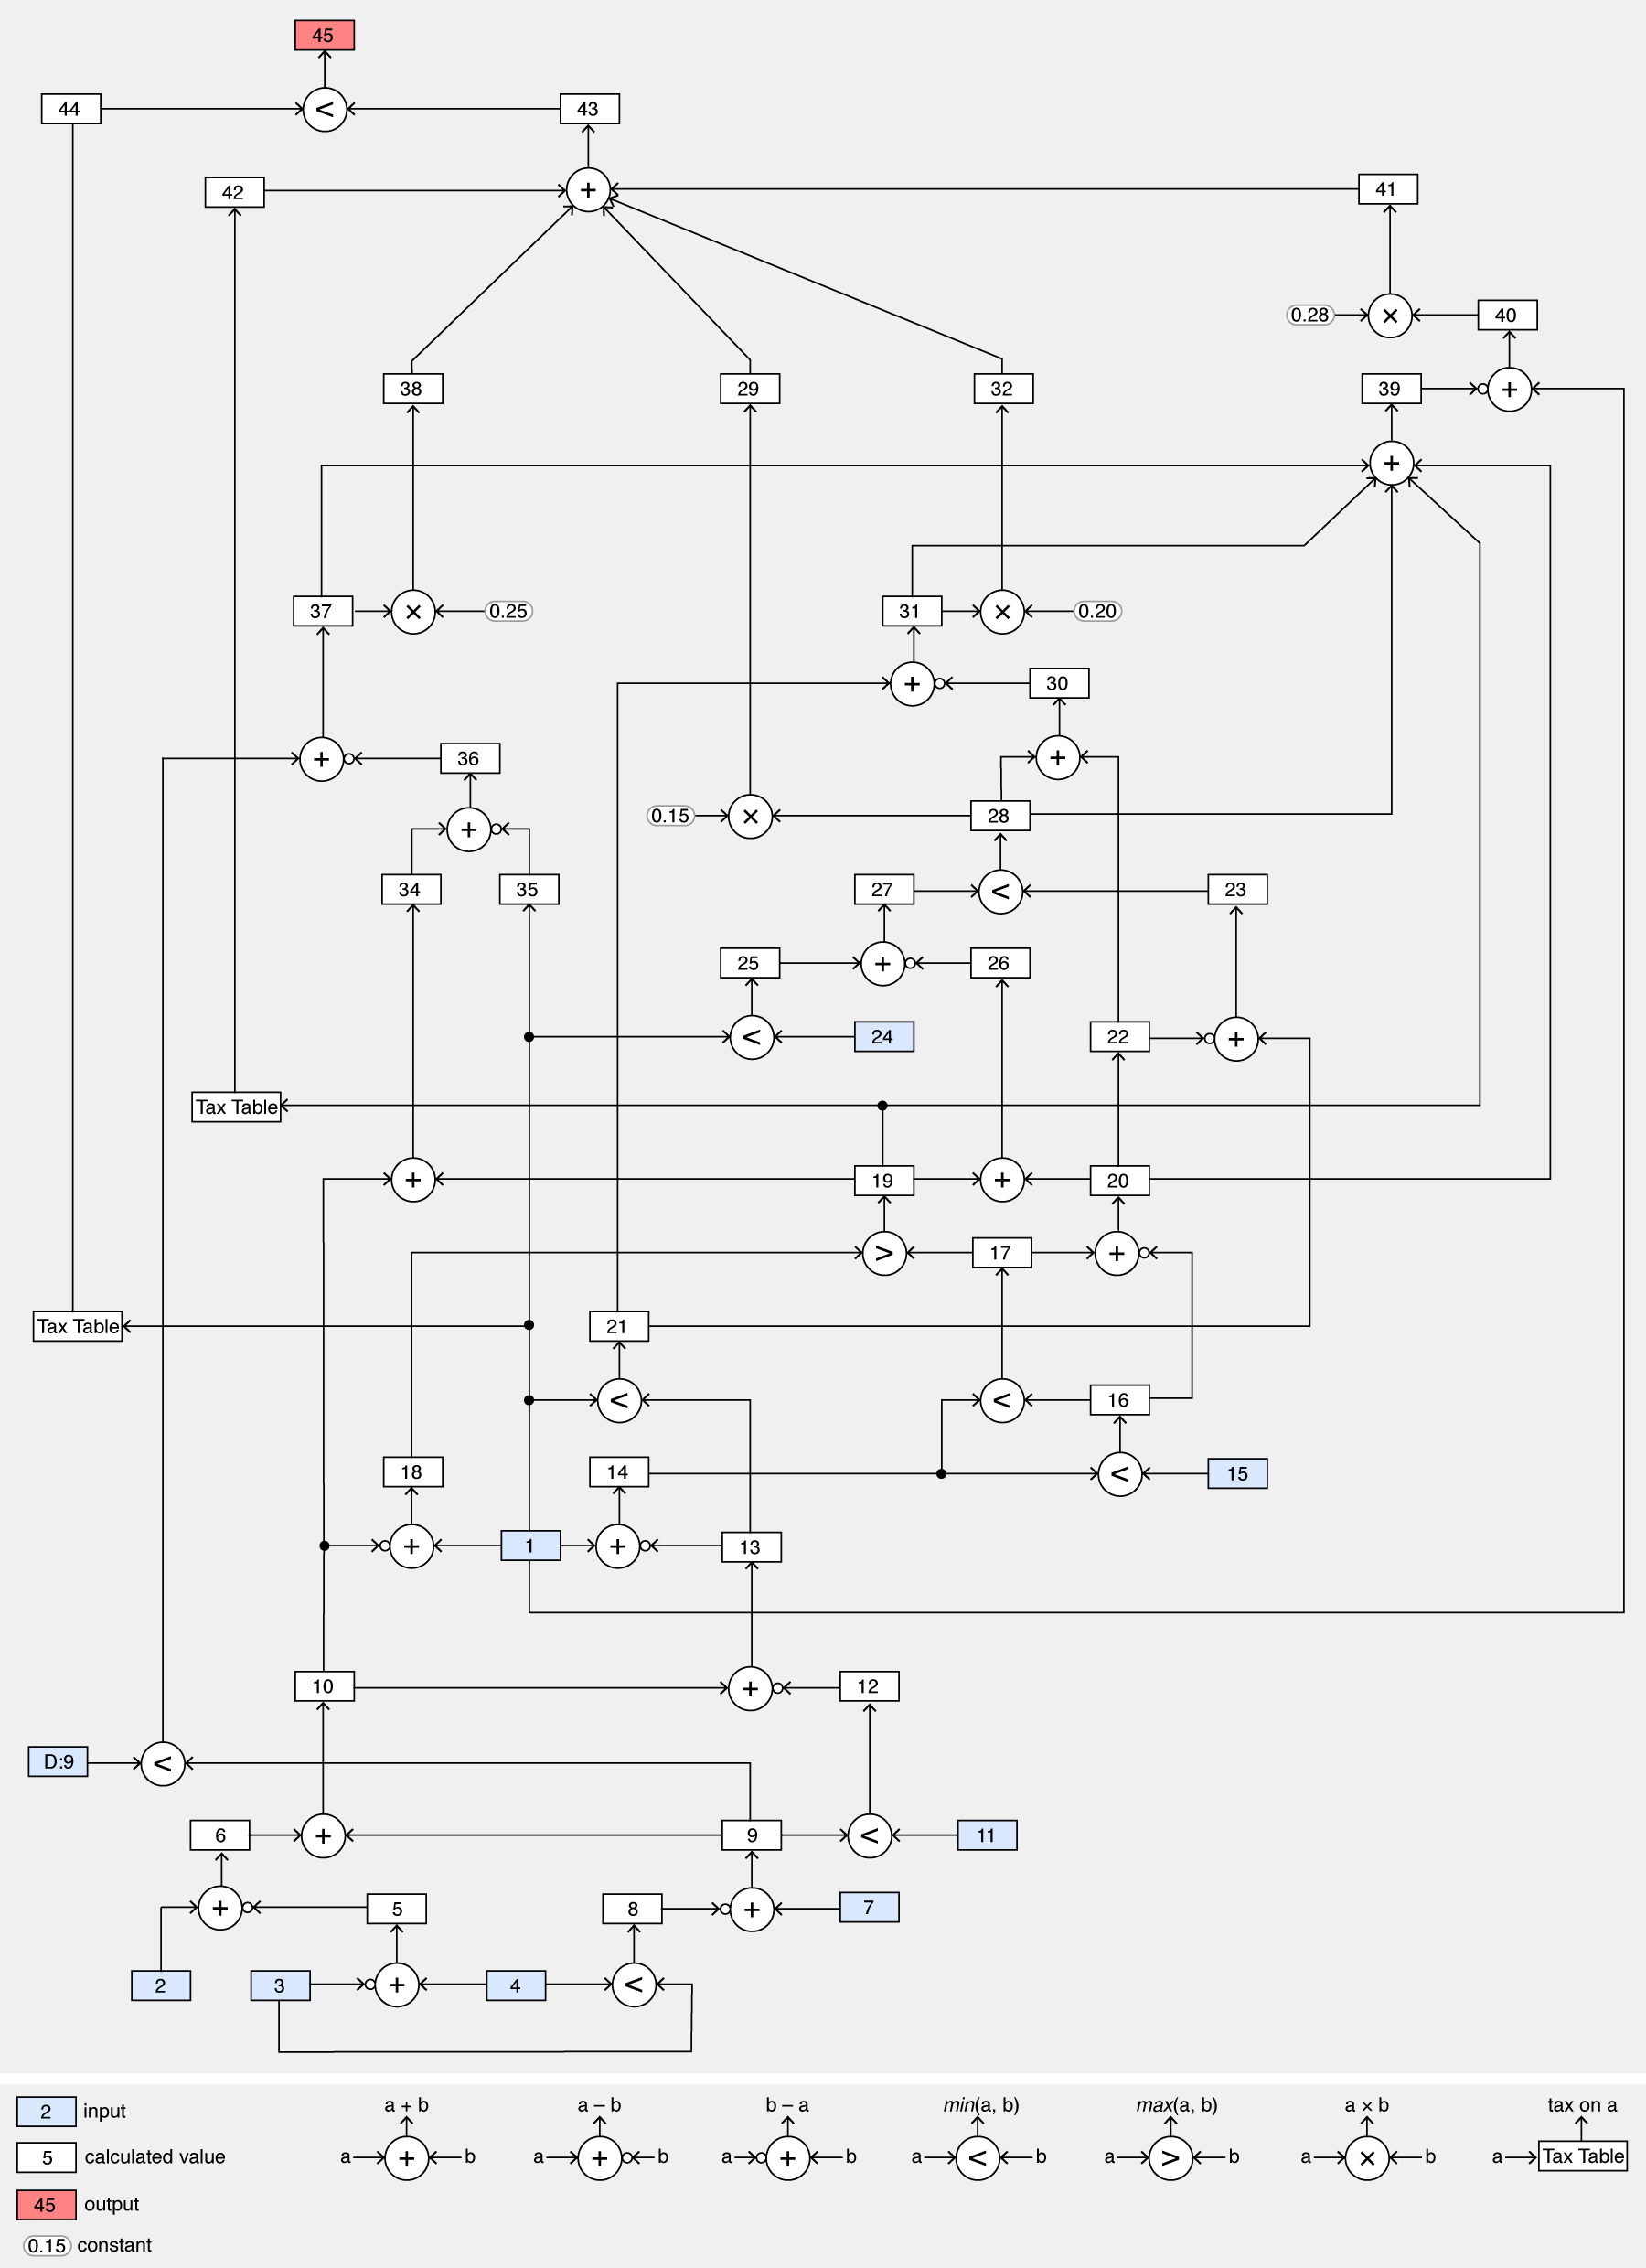
The directed graph has 82 nodes and 96 edges. Twelve subtractions, seven additions, four multiplications, ten comparisons, and two table lookups. Now that’s an algorithm! It’s gnarlier than calculating the date of Easter.
What are the chances that I correctly followed all the steps of this algorithm? What are the chances that the published algorithm correctly implements the intent of the tax code?