In the 1930s and 40s George Kingsley Zipf studied word frequencies in several languages and came up with a general observation: If you sort all the words from commonest to rarest, the frequency of the word at rank r is proportional to 1/r. This law has a distinctive graphical interpretation: Plotting the logarithm of frequency against the logarithm of rank yields a straight line with a slope of –1.
Do the Google n-grams obey Zipf’s law? When commenter Nick Black raised this question, I didn’t know the answer. Now I do.
Here’s a log-log plot of the number of occurrences of a word w as a function of w‘s rank among all words:
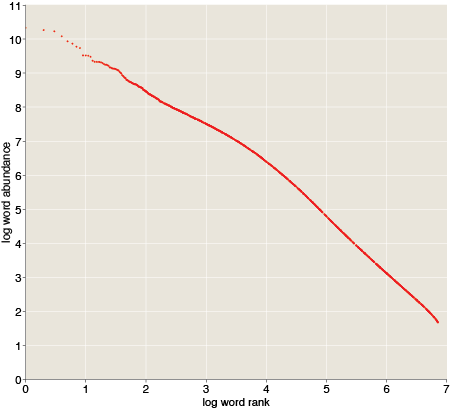
We don’t have a straight line here, but it’s not too far off. You can get a good fit with two piecewise straight lines—one line for the top 10,000 ranks and the other for the rest of the 7.4 million words.
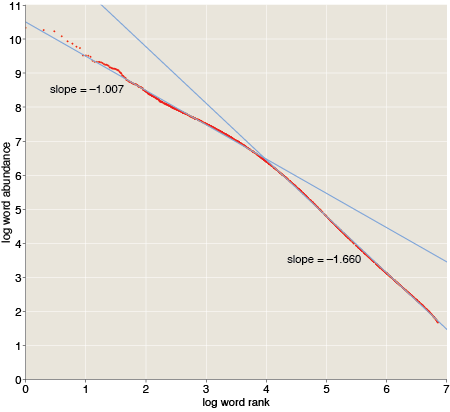
The upper part of the distribution is quite close to Zipf’s prediction, with a slope of –1.007. The lower part is steeper, with a slope of –1.66. Thus the communal vocabulary seems to be split into two parts, with a nucleus of about 10,000 common words and a penumbra of millions of words that show up less often. The two classes have different usage statistics.
I don’t have any clear idea of why language should work this way, but very similar curves have been observed before in other corpora. For example, Ramon Ferrer-i-Cancho and Ricard V. Solé report slopes of –1.06 and –1.97 in the British National Corpus, with the breakpoint again at roughly the rank 10,000. (Preprint here.)
Incidentally, the Zipf plot is truncated at the bottom because the n-gram data set excludes all words that occur fewer than 40 times. Extrapolating the line of slope –1.66 yields an estimate of how large the data set would have been if everything had been included: 77 million distinct n-grams.