
Where I grew up, a dotted line ran through the neighborhood, just beyond my back yard. On maps, that line marked the boundary between the city of Philadelphia and its inner-ring suburbs. On the ground, it was a racial divide—absolute and knife-edge sharp. Our side was all white. The public schools I attended had an enrollment of roughly 8,000, with just three black students. The community on the other side of the line was our racial mirror image, almost entirely black.[*]
Revisiting the old neighborhood 50 years later, I have been pleased to find the boundary softened and blurred somewhat. Families have drifted across the line in both directions. However, it’s not yet time to celebrate the end of residential segregation in American cities.
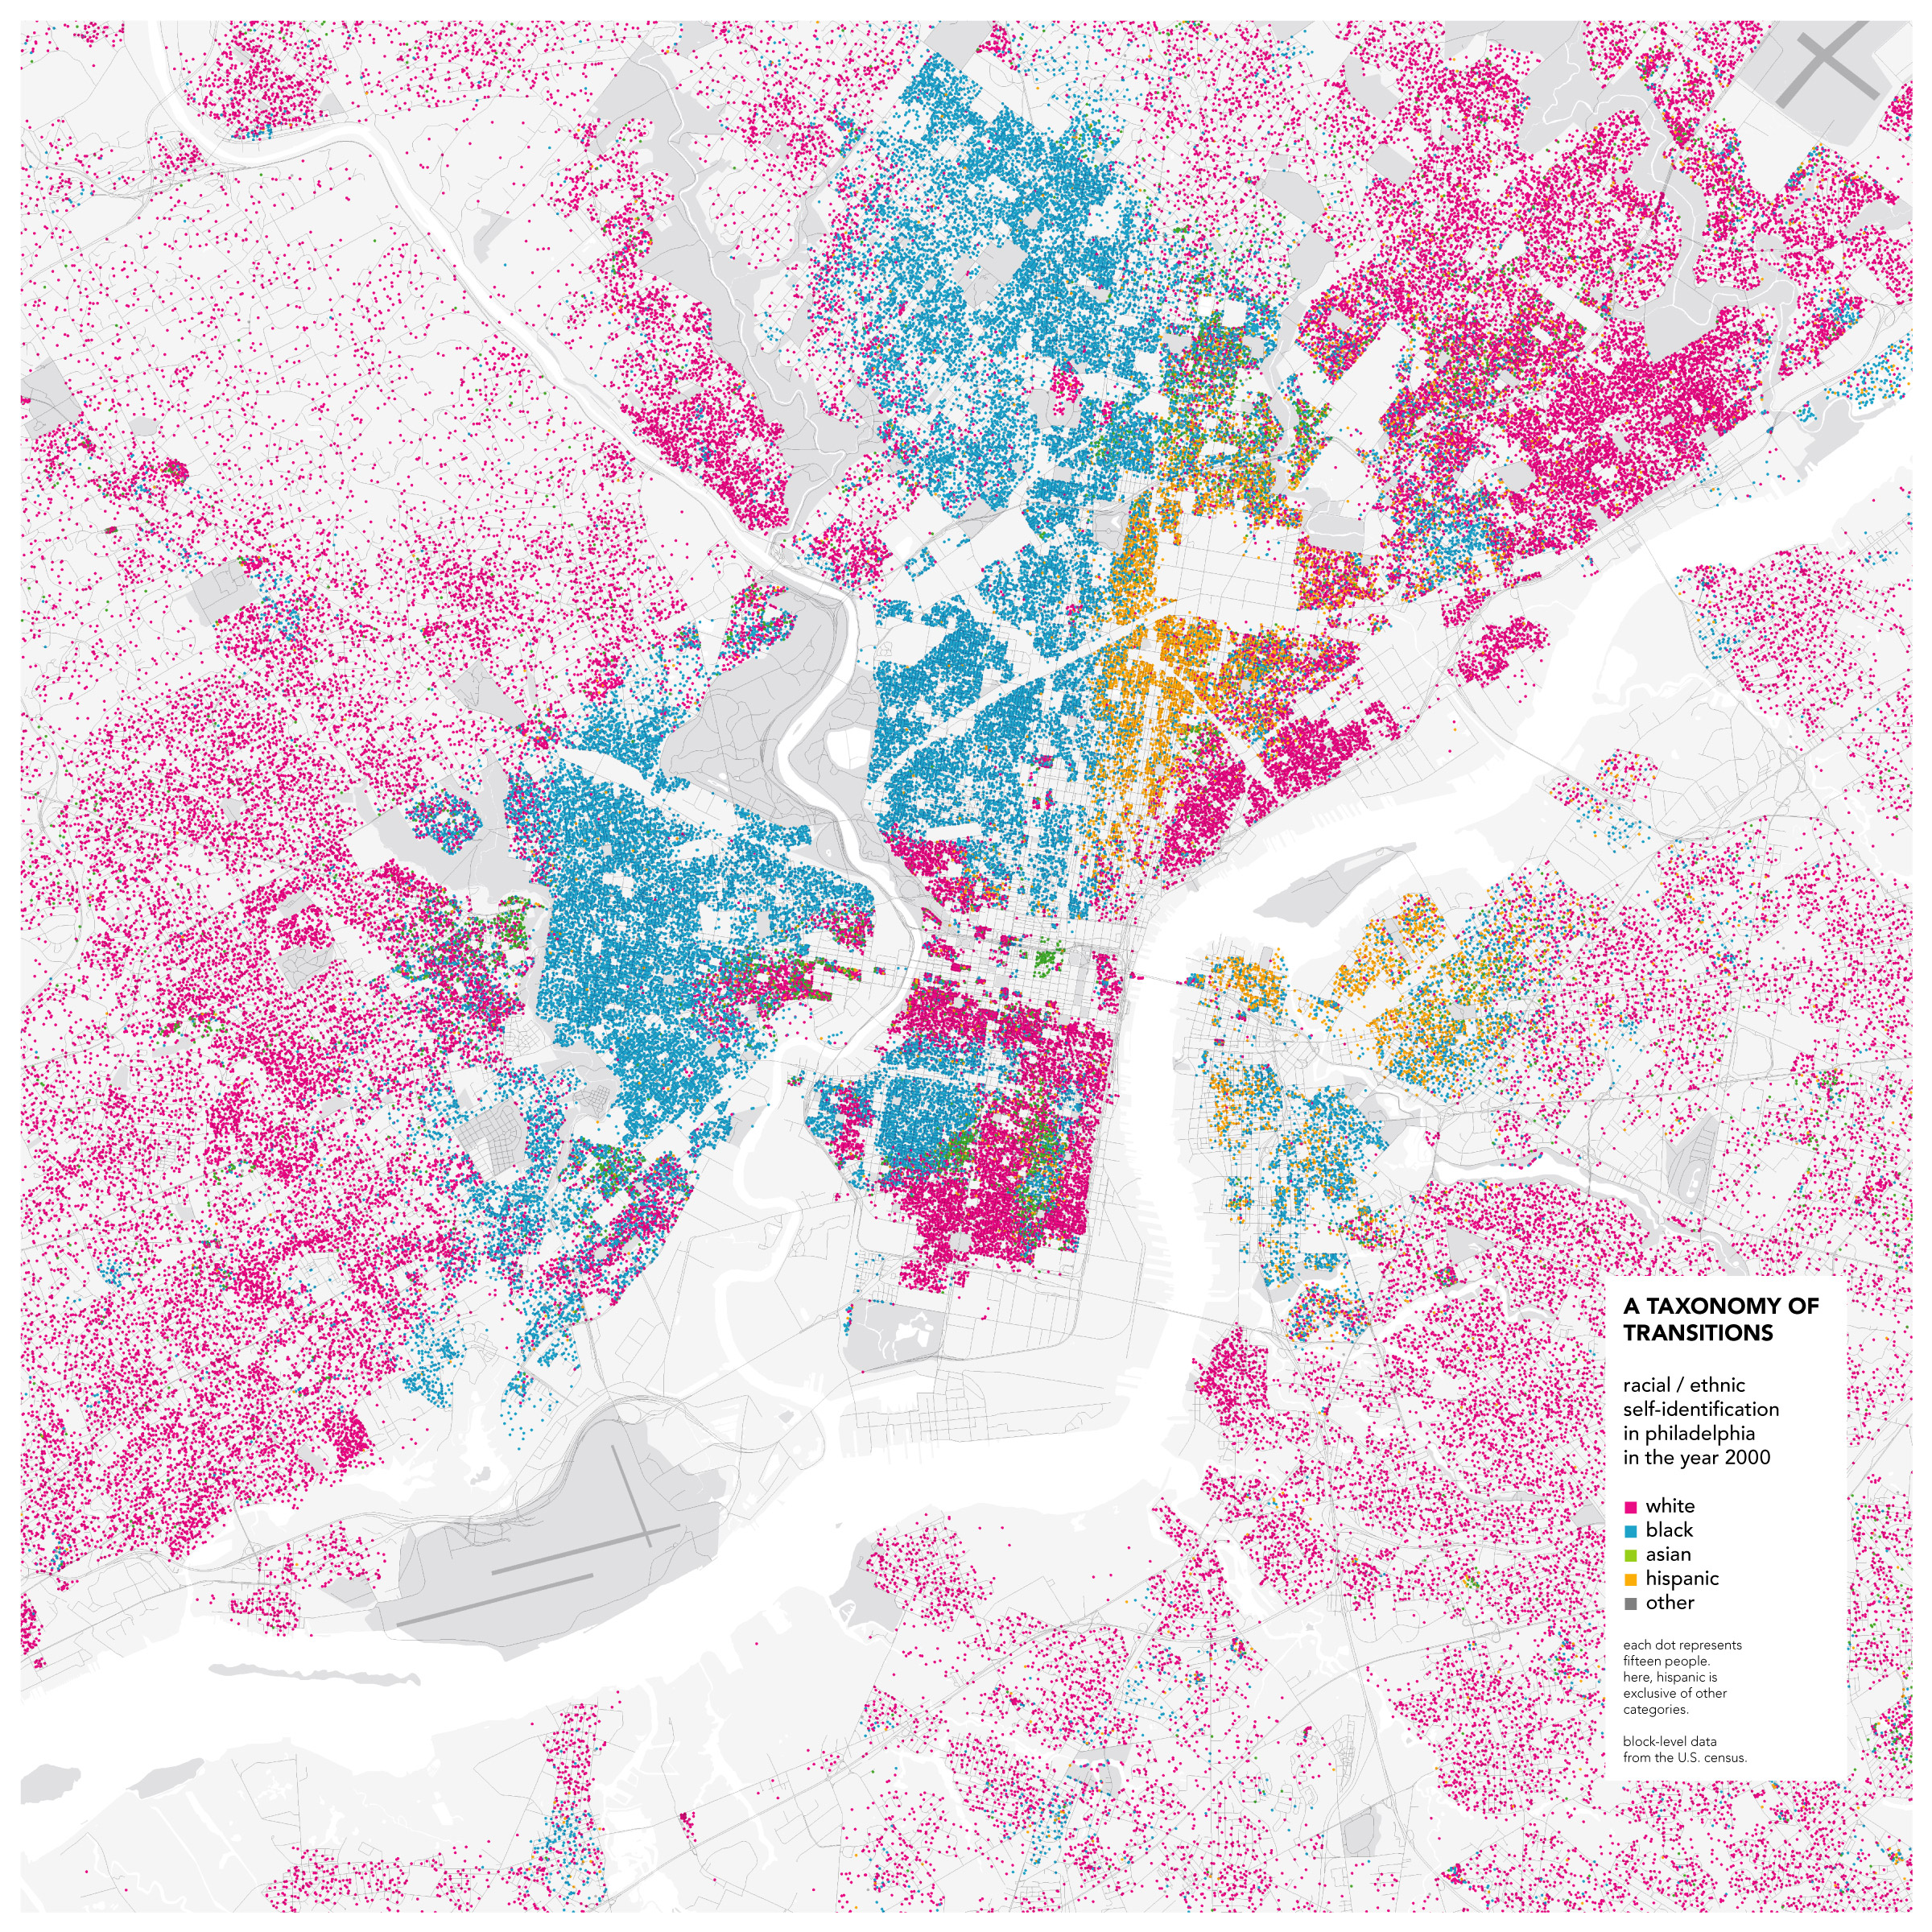
I’ve recently learned about a remarkable set of maps showing population distribution by race and ethnicity in more than 100 metropolitan areas. The maps were created by Eric Fischer, a Bay Area programmer with an interest in cartography and urban life (and also, incidentally, the author of a wonderfully detailed history of ASCII). Here’s Fischer’s map of the Philadelphia area, based on block-level data from the 2000 U.S. Census:
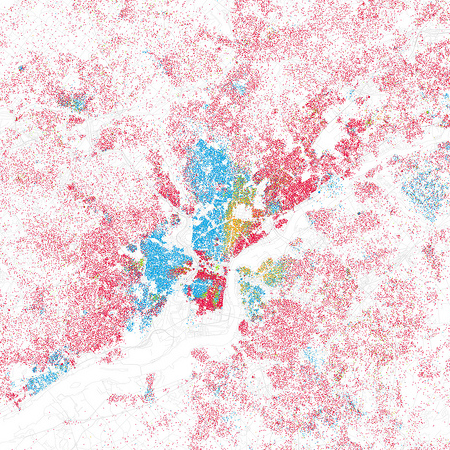
 Each dot represents 25 people, coded according to the color key at right. The image is at reduced resolution, and I’ve had to crop it slightly to fit this space. For a clearer view I recommend looking at the full-size and full-resolution images (3,000 × 3,000 pixels), which are all available on Fischer’s Flickr stream under a Creative Commons license.
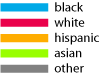
Below is a detail of Philadelphia’s western boundary. The Schuylkill River winds along the right edge of the frame; I’ve added a black circle to mark my childhood turf.
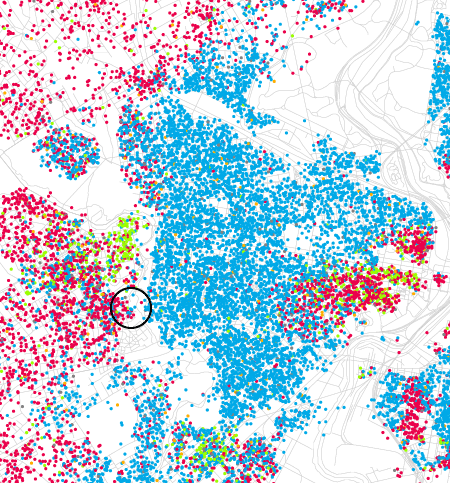
And here’s Fischer’s map of Detroit, the most extreme case in the whole collection, with the city’s northern boundary sharply delineated along Eight Mile Road:
I suppose no one will be shocked to learn that racial divisions persist in the U.S., but I do think these maps offer particularly vivid evidence. Fischer was inspired to create the maps by earlier work of Bill Rankin, a historian and cartographer currently at Harvard. Using Census data, Rankin mapped the distribution of income as well as the geography of race and ethnicity in neighborhoods of Chicago and its suburbs. Rankin writes:
Any city-dweller knows that most neighborhoods don’t have stark boundaries. Yet on maps, neighborhoods are almost always drawn as perfectly bounded areas, miniature territorial states of ethnicity or class.
An apt example of those “miniature territorial states” is on exhibit in the map of Philadelphia reproduced below, which was prepared in 1936 by the Home Owners’ Loan Corporation:

The boundary lines drawn here determined where home mortgages were available; the red “hazardous” areas were effectively off-limits to lenders. It’s well known that there was a strong correlation between race and the “redlined” areas of such maps. (At the time, the West Philadelphia neighborhood near where I would later live was rated “still desirable,” or in other words mostly white. The change came after World War II.)
The process of creating a “miniature states” map from distribution data involves at least two levels of abstraction. First you have to carve the mapped area into distinct regions, choosing where to draw the boundaries either by eye or by some algorithmic method. Then you flatten the data within each region, turning what is surely a heterogeneous area into a uniformly pink or blue or yellow district.
For his Chicago maps Rankin adopted a more direct alternative: In each census block he drew a dot of the appropriate color for each 25 people of a given racial group or income category. The dots were randomly placed within the blocks. For example, my boyhood block near Philadelphia is listed in the 2000 census as having a total population of 95, of whom 66 are white, 25 are black, and 4 are Asian. Thus there ought to be 2.64 red dots, one blue dot and 0.16 green dots in the map area corresponding to that block. (How best to deal with fractional dots is an interesting methodological question.) Rankin drew the maps with the ArcGIS geographic information system, which has a built-in function for random-dot mapping. When Fischer undertook his 100-city mapping project, he wrote his own code for dot placement, based on a simple approximation. Instead of choosing random coordinates within the polygons that define the census blocks, Fischer placed the dots at random within disks of equivalent area, centered on an “internal point” that the Census Bureau specifies for each block. With this scheme some of the dots may stray outside the bounds of a census-block polygon, but the inaccuracy is probably minor at the scale of a metropolitan area. If one were to refine the technique, it might be helpful to replace the arbitrary constant of 25 persons per dot with a parameter that depends on the scale of the map. Thus close-up views of neighborhoods would have finer resolution.
To my taste, the dotty style of mapping has at least two major advantages over the “miniature states” approach. First, a single graphic device successfully conveys two kinds of information; it shows overall population density as well as racial/ethnic composition. (The empty areas of these maps are sometimes as intriguing as the populated ones—it’s fascinating to see how much land we are willing to cede for golf courses, airports and cemeteries.) Second, in the dotted maps, boundary lines are not imposed on the data but rather emerge from the data. Moreover, we can see at a glance just how hard-edged or fuzzy each boundary is.
• • •
Beyond matters of cartographic technique, there is the question of what social meaning we should attribute to these maps. Why are so many cities divided into large monochrome domains? In the 1950s, the whites-only status of some neighborhoods was enforced by coercive means—legal and illegal, and occasionally violent. That has changed, and yet the boundaries persist. Why? This is a huge question, the subject of learned dissertations, and I don’t pretend to have an answer. But I would like to say a word about one well-known mathematical model that seems to offer hope of a benign explanation.
In the late 1960s Thomas C. Schelling, an economist now at the University of Maryland, devised a simple lattice model of residential segregation. Quoting myself:
Black and white residents, initially scattered at random over the nodes of the lattice, were assumed to prefer living among neighbors of the same race; those who were unhappy with their current surroundings could move. Schelling’s most provocative finding was that it doesn’t take vicious bigotry to produce a sharply segregated housing pattern; even the mildest preference for neighbors of the same race leads to a phase separation.
Thus we are invited to believe that our social landscape is a product of congregation rather than segregation.
Do the Rankin and Fischer maps lend any support to this notion? Well, the maps don’t look much like computer simulations of the Schelling model (there are dozens on the web), which tend to yield sinuous, pulsing blobs of population, like zebra stripes or leopard spots, and not at all like Eight Mile Road. But maybe that’s just because the simulations are run on a perfectly uniform background, whereas real cities have rivers and freeways and other physical barriers, as well as political and administrative boundaries, not to mention gradations in the size and price of houses. I suppose it’s appropriate to say that further research is needed.
It will probably be a few years before we have block-level results from the 2010 census. When those numbers start coming in, I look forward to revised versions of these maps. I’m hoping they’ll look a little fuzzier.
[Note: Schelling's main paper on the segregation model does not seem to be available online. The journal reference is: Schelling, Thomas C. 1971. Dynamic models of segregation. Journal of Mathematical Sociology 1:143--186. Dietrich Stauffer and Christian Schulze have written a lucid, somewhat critical, description and evaluation of Schelling's model, available at arXiv:0710.5237.]
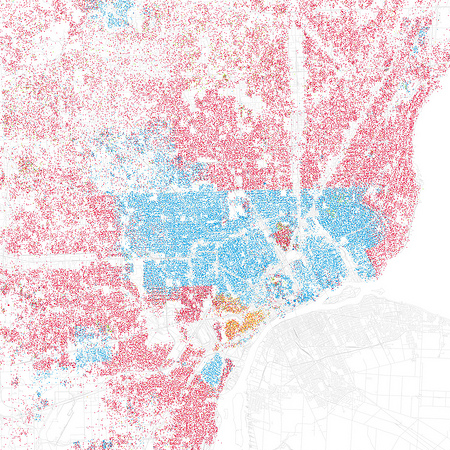
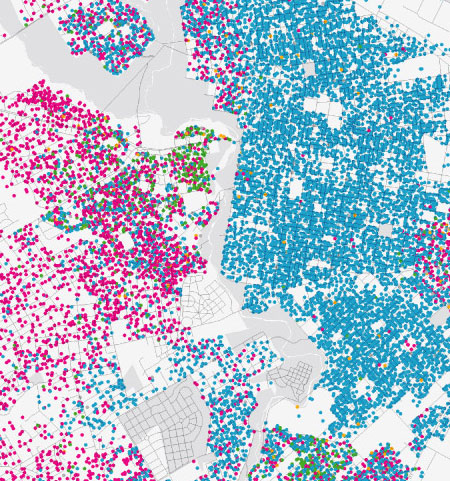
Update 2010-10-24: Bill Rankin writes to let me know that he has a Philadelphia map prepared with his more-precise technique of placing dots at random within the bounds of census-block polygons. Below is a detail of West Philadelphia and some of the adjacent suburbs. The complete map is available here.
It’s online at CiteSeerX, actually. What’s curious is that EBSCOhost, which contains that journal, says there are only book reviews on pages 143 and 144 of that volume, and doesn’t even admit the existence of pages past 144; see here if you have access.