Harvard SEAS March 30, 2012
Brian Hayes
brian@bit-player.org
Computation and the Human Condition
March, 1972
Part 1. Computing the Future
Foreboding
-
1962: Rachel Carson, Silent Spring.
-
1968: Paul (and Anne) Ehrlich, The Population Bomb.
-
1968: Garrett Hardin, "The Tragedy of the Commons."
-
1971: Barry Commoner, The Closing Circle.
-
Lots more...: The Cuyahoga River catches fire. Oil from an offshore spill washes up on the beaches of Santa Barbara. The "Earthrise" picture from the moon. "Spaceship Earth." The EPA is created. Greenpeace too. And OPEC, which had us waiting in line to fill up the tank, and going 55 out on the highway.
Earth Day, 1970

Nerdy environmentalism
Since ours is a formal, or mathematical, model, it also has two important advtanges over mental models. First, every assumption we make is written in a precise form.... Second,... implications for the future behavior of the world system can be traced without error by a computer, no matter how complicated they become.
Limits to Growth, p. 22
Nerdy catastrophe
If the present growth trends in world population, industrialization, pollution, food production, and resource depletion continue unchanged, the limits to growth on this planet will be reached sometime within the next one hundred years. The most probable result will be a rather sudden and uncontrollable decline in both population and industrial capacity.
Limits to Growth, p. 23
ASCII infographics
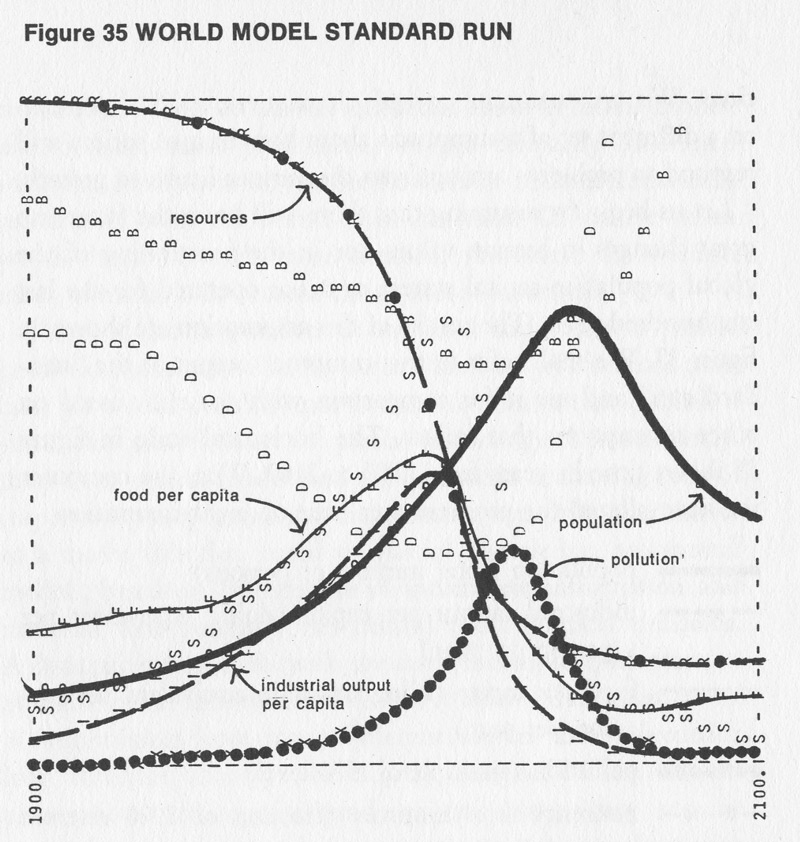
World3, standard run
World3, double-resources run
Jay Forrester and Project Whirlwind

A core memory

Origins
- The trajectory of Forrester's career: from servomechanisms to computers to "system dynamics," moving to the Sloan School of Management in 1956.
- Forrester writes Industrial Dynamics and then Urban Dynamics.
- The Club of Rome (which calls itself an "invisible college") invites Forrester to apply his ideas to the global economy and ecosystem. He proceeds with the project, but declines the club's sponsorship. Publishes World Dynamics.
- Dennis Meadows, a colleague and former student of Forrester at the Sloan School organizes the project for The Club of Rome.
- A team of 17 spends about a year refining and enlarging the Forrester World2 model; the result is World3.
- The book lists four authors, but Donnella Meadows wrote most of it.
Reception
- 10 million copies. 30 languages. A good read.
- Helps spread awareness of the concepts of exponential growth and feedback.
- Helps spread awareness of mathematical modeling and the use of computation to explore "the human predicament."
- Scares people!
Criticism
- Vitriolic attacks from economists and mathematicians. Sussex Models of Doom.
- Iffy input data.
- Aggregated variables: one resource, one pollutant, one food, one population.
- No geographic structure, no social distinctions. "Average food per capita."
- Implausibly intricate chains of causal connections.
- Difficulty of sensitivity analysis.
- Questions about reversibility. Questions about data initialization.
- Total lack of statistical analysis: No error bars.
Starting simple...
From the world of population biology we have the Lotka-Volterra equations:
\begin{aligned}
\frac{dx}{dt} & = x(\alpha - \beta y) \\
\frac{dy}{dt} & = -y(\gamma - \delta x) \end{aligned}
Two equations with four free parameters (\(\alpha, \beta, \gamma, \delta)\) describe a rich spectrum of behavior. In the absence of predators, the prey species would proliferate without limit, \(x \rightarrow \infty\). In the absence of prey, the predator species would die out, \(y \rightarrow 0\). But when you put them together, what you get is not (generally) a simple equilibrium. Instead the two populations enter into cyclic oscillations.
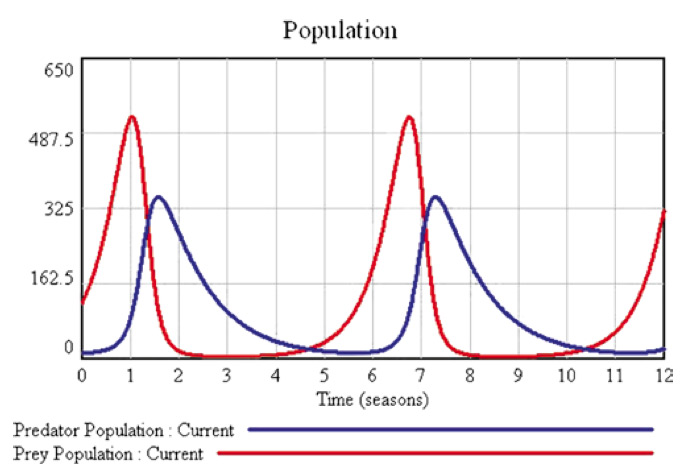
An agent-style simulation by http://jseed.sourceforge.net/.
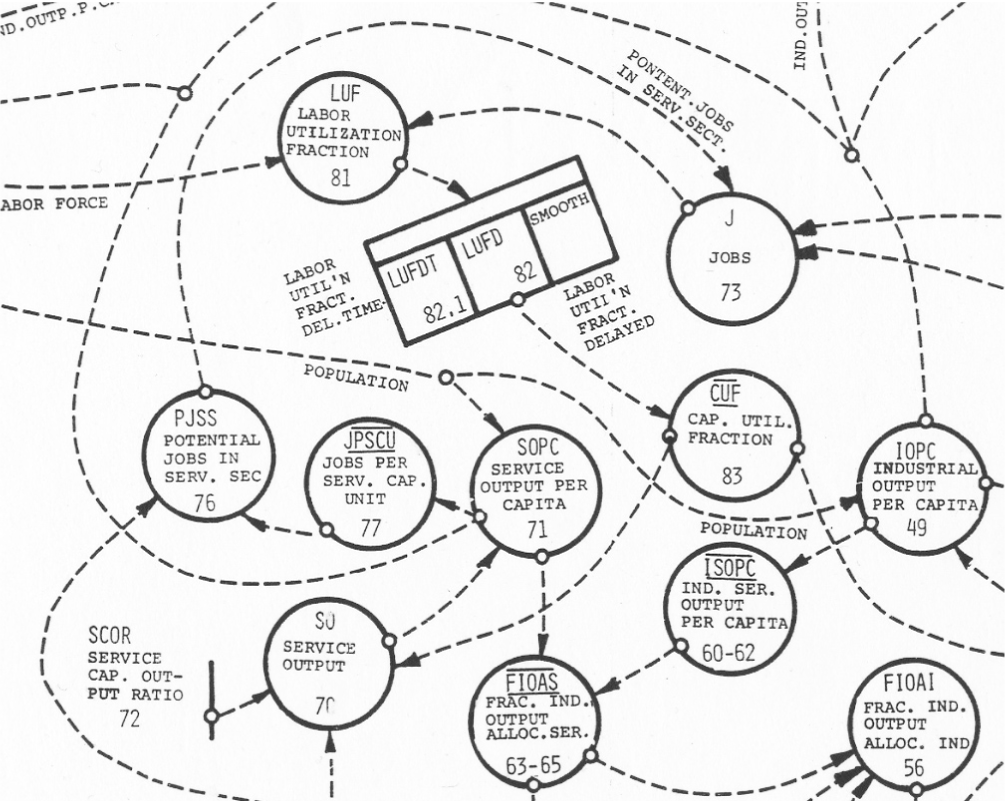
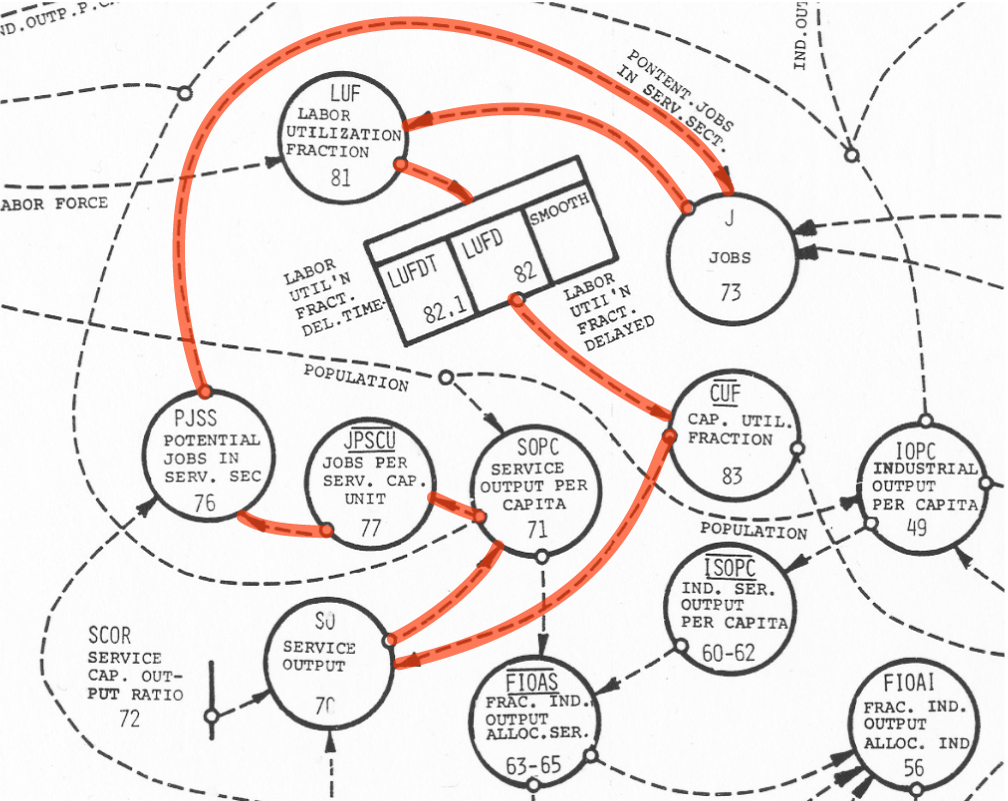
Plumbing and wiring
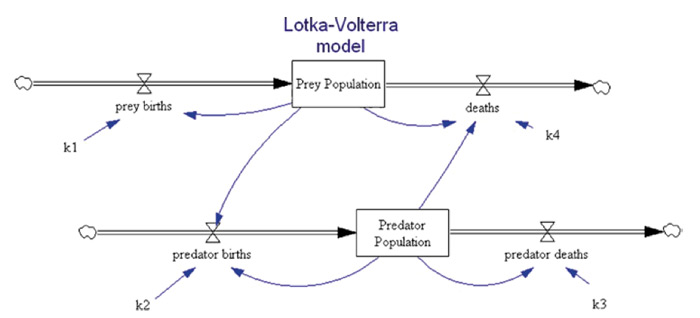
The Lotka-Volterra model in the iconography of system dynamics, with valves, flows and reservoirs.
Like the schematic of an oil refinery
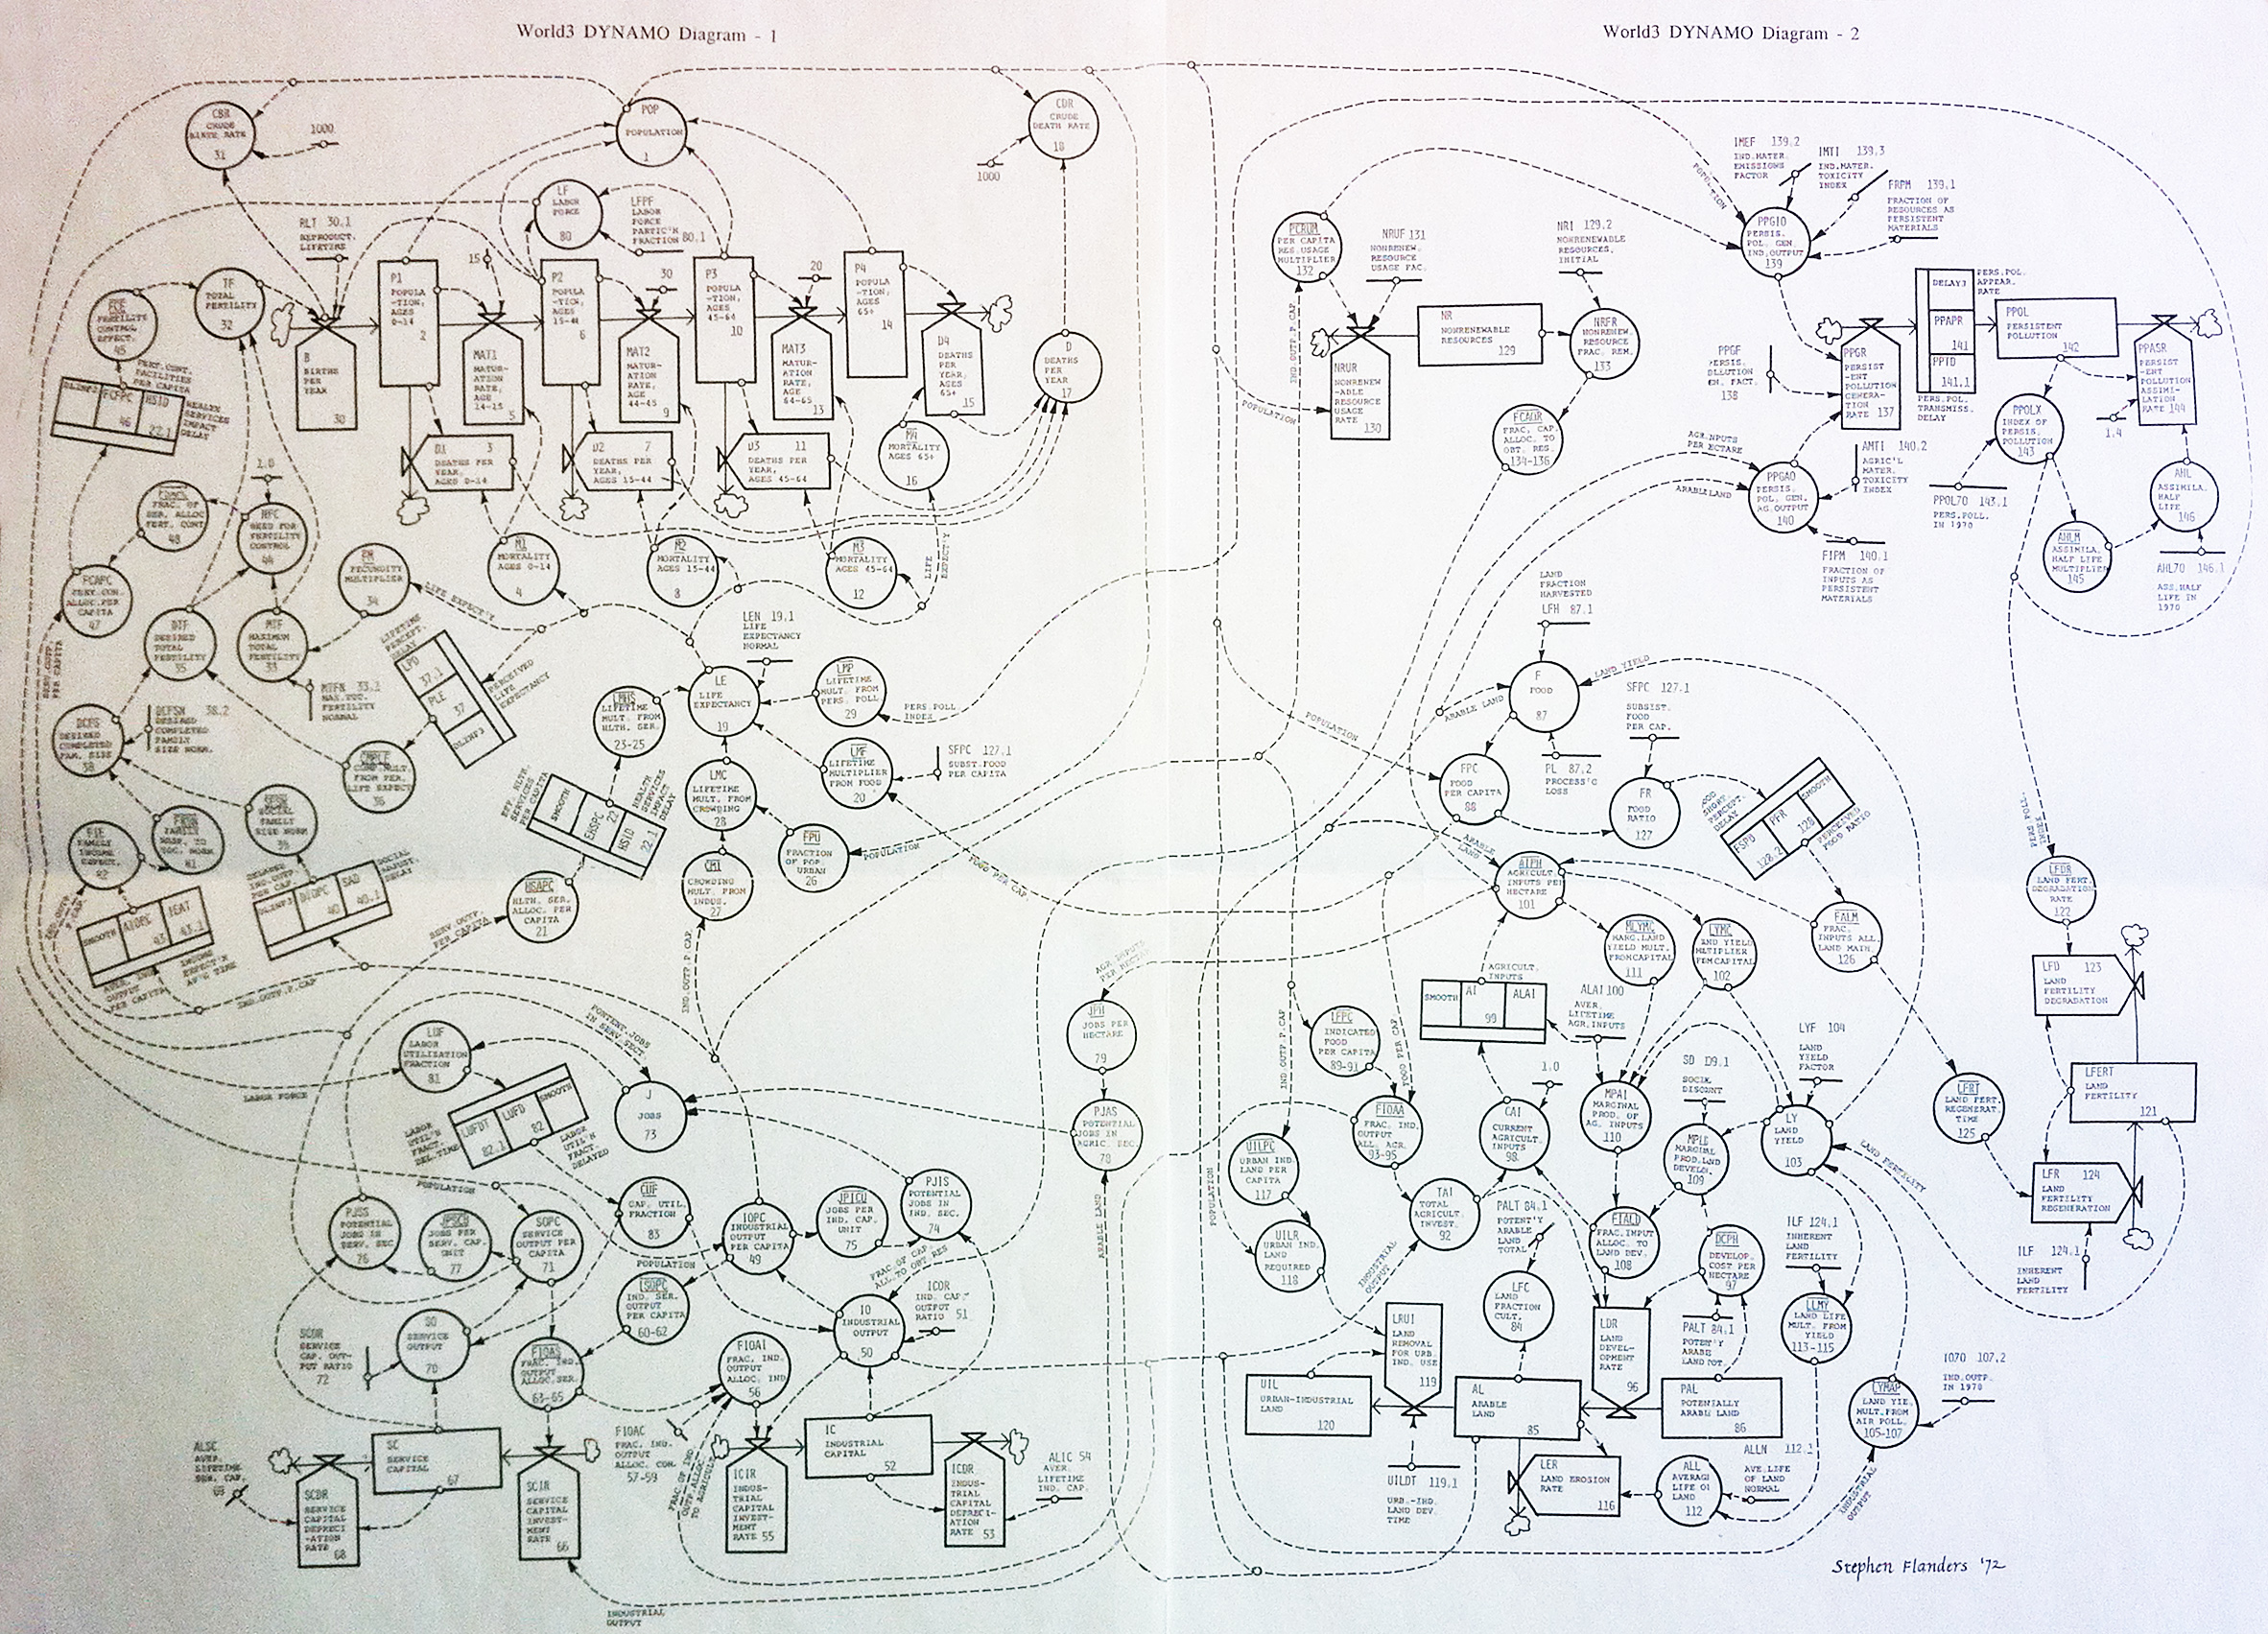
bigger
Plumbing and wiring: a detail
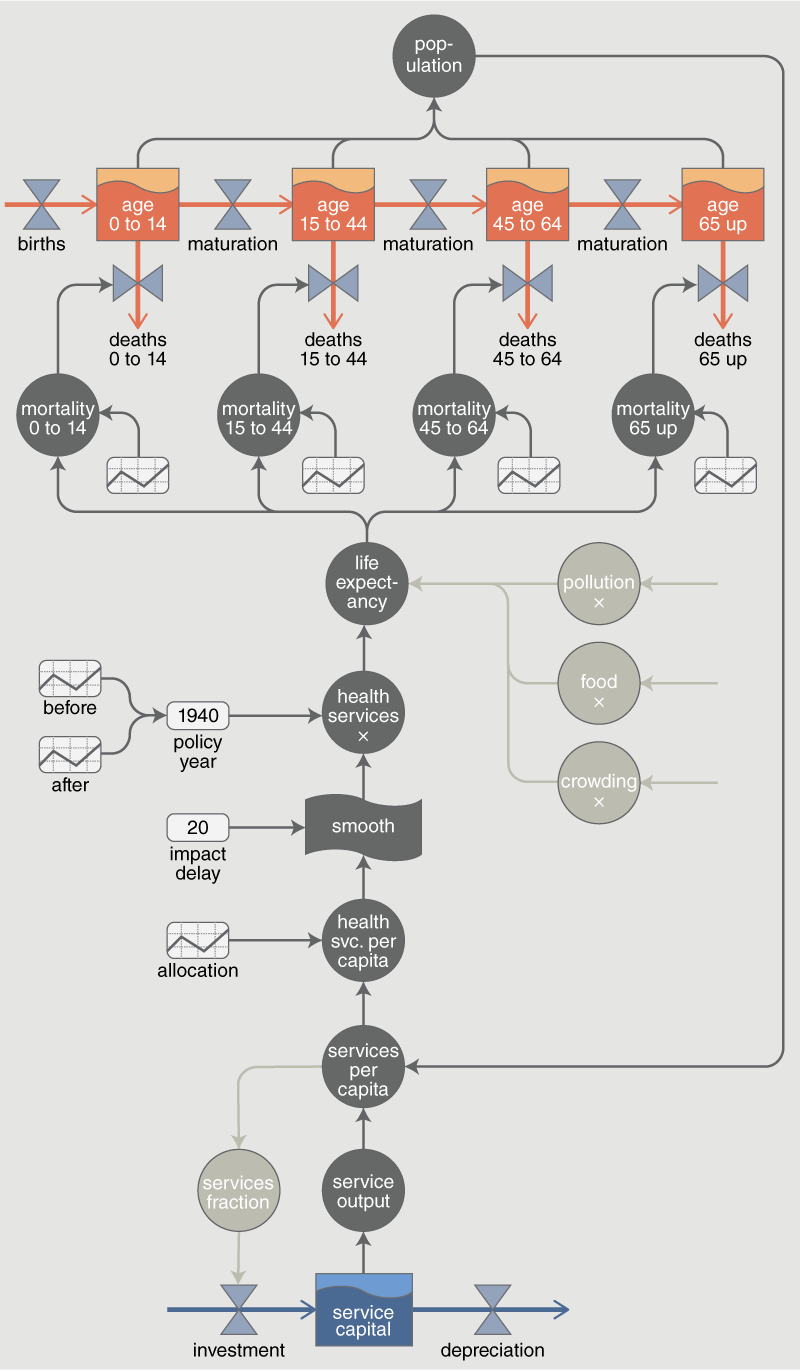
Levels and rates
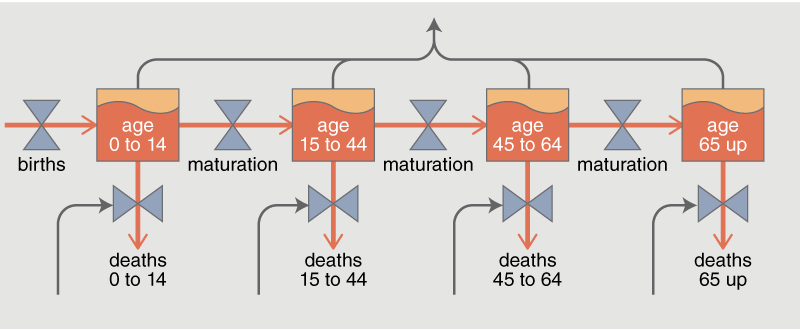
- Metaphor of vats and valves.
- Obey conservation laws: the books must balance.
- Only sums and differences (or integrals and derivatives).
- The main elements of the model, as seen from outside the box.
Auxiliary variables
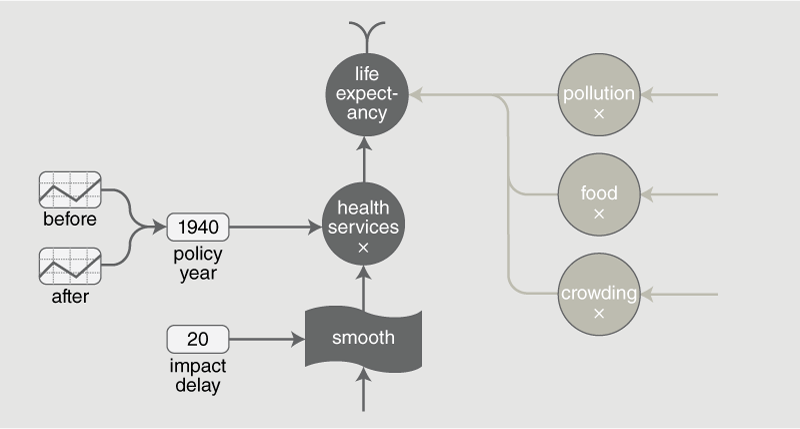
- Wiring rather than plumbing.
- Information flows: bits rather than atoms.
- No conservation laws: Anything goes (if dimensions match).
- Can implement arbitrary (real-valued) functions.
- Inside the box, this is most of the model.
Knobs to twiddle
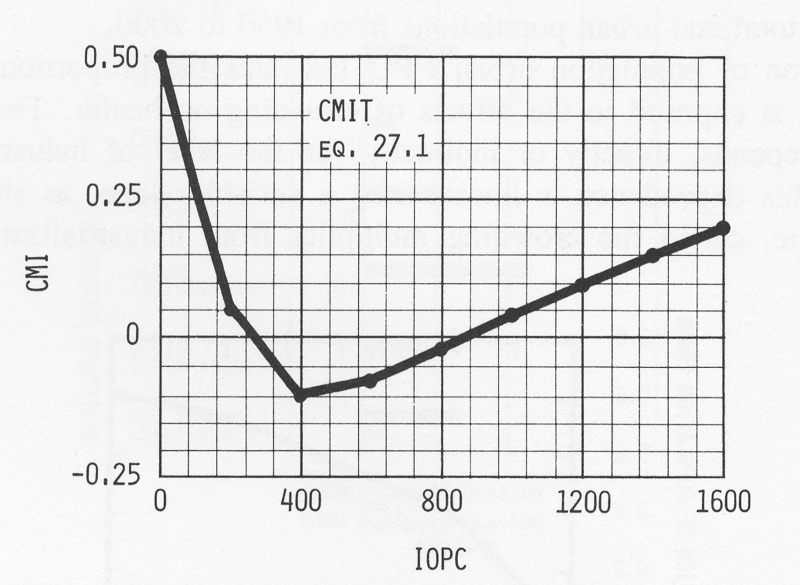
Arbitrary functions represented by piecewise-linear "tables". (This one relates wealth to the effects of crowding on life expectancy.)
How many knobs?
- The plumbing-and-wiring diagram has about 150 nodes.
- 12 levels and 21 rates in the plumbing sector; all the rest is wiring.
- 46 table-defined functions, and overall >400 constants and coefficients.
- This overestimates the number of free parameters, but there are still lots!
- Combinatorial difficulty of testing and sensitivity analysis.
- Wil Thissen found that actual model runs explore only a tiny fraction of parameter space, and many of those tables could be replaced by single constants.
The urge to elaborate
- Everywhere you look, you see more opportunities to add frills and furbelows.
- E.g., distinguish between different kinds of medical services: pediatrics vs. geriatrics.
- Would such refinements strengthen the structure of the model?
- Forrester's World2 model was simpler, yet had similar behavior.
More combinatorial complication
- How are signals combined?.
- Life expectancy defined as the product of four factors, acting on a "normal" value of 28 years. Why a product and not a sum? Or some other function?
- Hard to quantify the information content of such decisions: How large is the space of alternatives?
Putting the pieces together
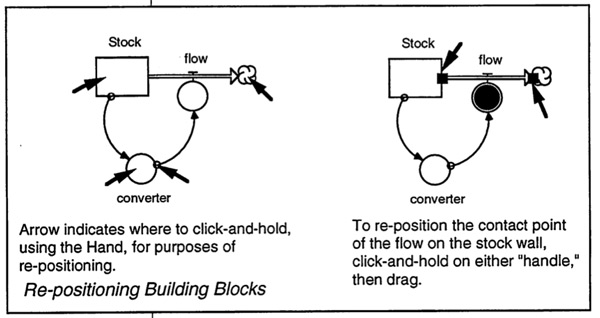
If we were building hardware, we might work directly from the diagram of vats and valves. System dynamics software offers that option even in software: Drag-and-drop model building in Stella II.
DYNAMO
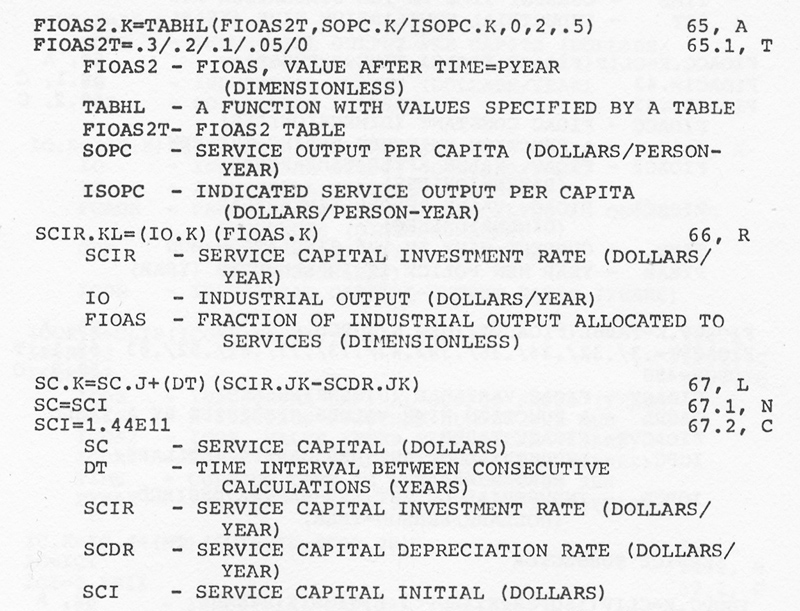
- World2 and World3 models were written in DYNAMO, a language created at MIT by Phyllis Fox and Alexander Pugh.
- A program is a list of "equations." Not quite declarative, but not procedural either.
- Roots go back to 1958 (era of Fortran, Lisp, Algol, COBOL).
- All the cruft you'd expect from the days of punch cards ("Do not type beyond column 72!)".
- But simulation languages seem to be fertile griound for innovation (think of Simula-67).
That was then...
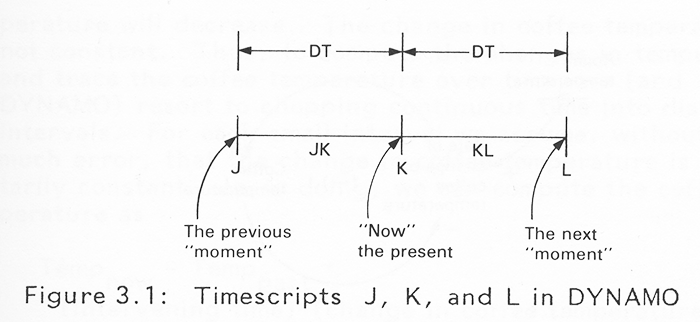
- The model of time in DYNAMO: \(j = \textit{then}, k = \textit{now}, l = \textit{next}\).
- The future happens: Shift forward by \(dt: j \leftarrow k \leftarrow l\).
- The mechanics of the process are kept behind the scenes, out of the programmer's notice.
- Curiously, the system of .J and .K suffixes maps directly onto modern OOP notation.
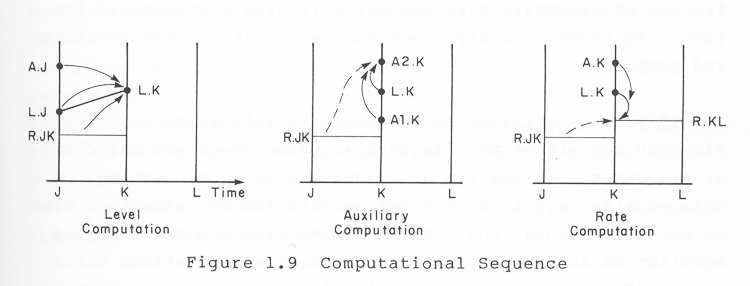
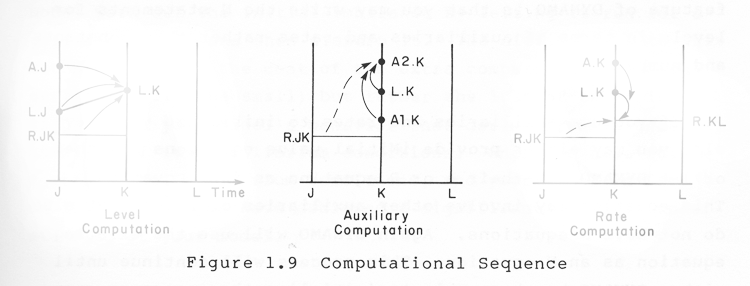
As time goes by
- "Time is nature's way of keeping everything from happening at once."
- But, contrary to W. Allen, in nature this stuff does happen all at once.
- For a (uniprocessor, single-threaded) computer, we need to choose a sequence for updating variables.
- Level variables first—and so they require initial values to get the process started.
- Auxiliary variables depend only on levels and other auxiliaries, not (usually) on rates.
- Rates are calculated last, and so they can access all other variables.
- Wash. Rinse. Repeat.
Topological sorting
- Still a sequencing problem: Auxiliary variables depend on one another, so who goes first?
- Must find an updating sequence that does not violate causality—a problem now known as topological sorting.
- The DYNAMO compiler automated this process. You could write equations in any order, and the compiler would reshuffle them as necessary (if possible).
- Pretty nifty for the time: The earliest linear algorithms for topological sorting were published circa 1960.
Causal loops
Causal loops
Opening the loop
- The network of auxiliary equations must be a directed acyclic graph.
- The 116 auxiliary equations in World3 have three illegal cycles.
- Akin to a race condition in combinational logic circuits.
- Fixed (?) by breaking the loop at an arbitrary node and using the previous value. (Must also provide an initial value.)
Part 3. The Human Predicament
What, me worry?
In the standard run of the World3 model, the peak year for wealth and well-being is somewhere near 2020—just around the corner. It's all downhill from there. Should we worry?
Disclaimers
This sort of model is an attempt not to predict the future but to illustrate the basic dynamic tendencies of a complex system under alternate policies.
Meadows et al., Models of Doom, p. 217
Claimers
System dynamics models suggest [that] sensitive control points for increasing the world-wide quality of life exist in the rate of generation of capital investment and in food production, but that expansion of industrialization and food output are the counter productive directions, both should be restrained. The common answer to world distress has been to increase industrialization and food production, but hope for long-term improvements probably lies in reducing emphasis on both.
Forrester, 1971
Forrester's dilemma
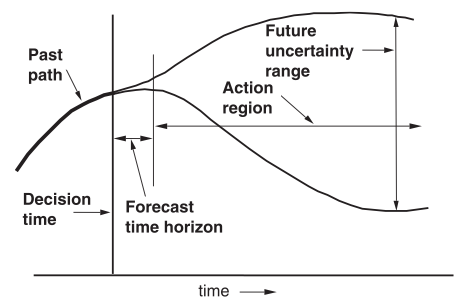
One can forecast future conditions in the region where action is not effective, and one can have influence in the region where forecasting is not reliable.
Forrester, 2007
Global warning
What about other kinds of models? Specifically, what about climate models?
Similarities
- Cover the same time scale, ≈ a century.
- Structurally similar, with levels and rates of flow for atmospheric CO2 and other substances.
- Importance of feedback loops.
Differences
- 15 people vs. 1500.
- Climate models are data-rich, with obsessive attention to the provenance and accuracy of measurements.
- Climate modelers work hard to quantify their uncertainty.
- The task of climate modeling is computationally harder but conceptually easier: Mostly physics, and we have laws of nature.
- But climate models are looking for more than "dynamic tendencies"; they need to accurately predict a tiny signal against a noisy background.
World4?
We believe [World3] is unique among all mathematical and mental world models available to us today. But there is no reason to be satisfied with it in its present form. We intend to alter, expand, and improve it as our knowledge and the world data base gradually improve.
The Limits to Growth, 1972
Thanks!
Brian Hayes
brian@bit-player.org
http://bit-player.org
Look for more on this theme in the May-June American Scientist.
←
→
/
#